Stocks continue to make all-time highs… if you missed the dip-buying opportunity… get over yourself.
As a trader, you can’t beat yourself up for missed chances… but there’s one thing you should ask yourself, Am I using the right patterns to spot money-making opportunities right now?
It’s okay because I’m here to help.
Today, I want to show you a pattern that works in any market environment. Heck, I’ve found success in bearish, bullish, and even choppy market environments with this setup.
The best part about this pattern?
Anyone can use it, all you need to do is look at the charts and execute… and I’ll show you the three factors to look out for if you want to use this pattern and EXACTLY how you could potentially replicate my $3,500 overnight winner.
[Exposed] How The Fish Hook Pattern Reeled In $3,500 Profits Overnight
Have you ever witnessed a stock plummet and think to yourself, “Wow… this stock is undervalued at these levels, and I want to buy them on the cheap… but I also don’t want to get caught in a selloff”?
Well, if you were ever in that boat before, it does get scary — trying to pick a bottom. Of course, if you go at it blindly and don’t look for key levels or patterns, it’s a dangerous game. This is where the fish hook pattern comes into play.
Basically, with the fish hook pattern, you all you have to do is look for three things:
- A stock plummets significantly, with no end in sight.
- The stock finally finds a support level and holds.
- The stock starts to catch a bounce and turns.
It might be hard for you to visualize at first, but check out this daily chart in Scorpio Builders (SALT).
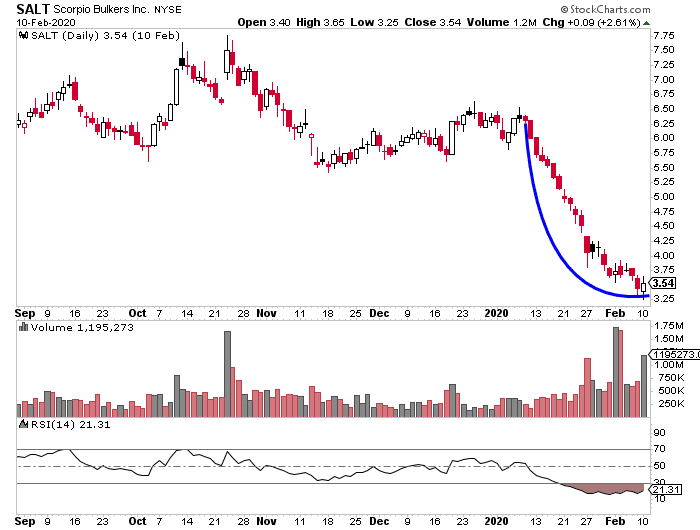
It looks like a fish hook if you think about it… right?
Looking at the chart above, you’ll notice all three conditions were satisfied. SALT sold off pretty hard and in just a few weeks, the stock lost nearly 50% of its value. Thereafter, it found a support level right around $3.25. Finally, it started to catch a bounce.
Not only that but if you look at the Relative Strength Index (RSI), the stock was in oversold territory. You’re probably wondering, Jason, what the heck is the RSI?
Do you see the line under the price chart? That’s all you really have to look out for. It’s a popular indicator that compares bullish and bearish price momentum and signals when stocks are overbought or oversold.
Generally, traders will use 30 (stocks are considered oversold if its below) and 70 (stocks are considered overbought if the RSI is above this level) as lines in the sand. For today, all you have to worry about is the 30 level in the RSI.
Typically, when I see that price action and the RSI below 30, it’s a signal the fish hook pattern could materialize… and I could reel in profits in a short time frame. If you look back to the chart in SALT, you’ll notice the RSI was well below 30, a clear signal it could reverse and come out of oversold territory and back to normal levels.
So what did I decide to do?
I bought shares of SALT to play the bounce. Now, with this specific setup, I don’t look for a whole lot. I know the stock isn’t going to recoup all of its losses, but I could find 10-20% winners in just a matter of days. When you compare that to the S&P 500, the fish hook pattern becomes extremely attractive.

Look at how the trade actually turned out…
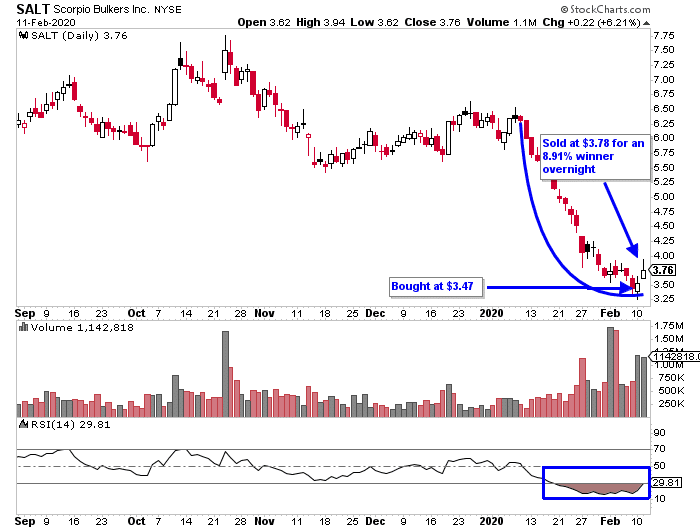
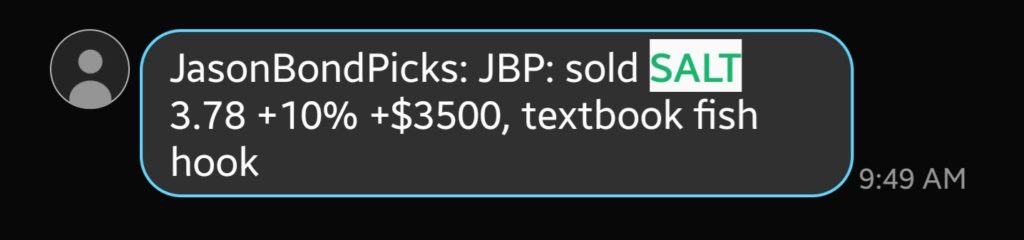
I bought shares at 12:53 PM EST and the following day, at 9:49 AM EST, I was able to lock in a $3,500 winner overnight! That was good for a near 10% winner.
Just imagine, if you could just nail a few of these trades a month… your trading account could grow at an exponential rate. If you want to learn how to spot these winners in real-time and consistently win in the market, then click here to watch this exclusive training session.
0 Comments