If you haven’t heard by now, I’ve expanded my edge in the markets by trading options. My success in Weekly Windfalls has driven me to start trading options directionally. Of course, this was a big leap for me from being a small-cap momentum stocks trader…
But I’ve finally gained the confidence to start throwing down directional bets with buying options.
The other day, I mentioned RH Inc. (RH) — formerly known as Restoration Hardware — as options play to my Jason Bond Picks clients.
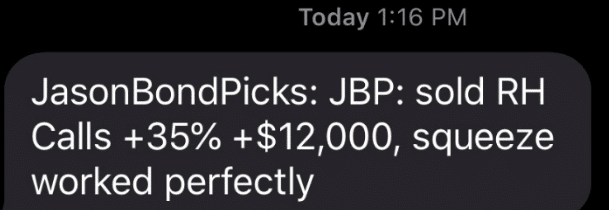
If you missed that alert, I’m sorry to say… but you missed out on a 35% overnight winner that netted me $12K in real-money profits.

(Stop hearing about my monster winners after the fact, and join Jason Bond Picks now.)
Don’t beat yourself up if you missed out on the massive trade… because there will be plenty more to come.
Today, I want to walk you through EXACTLY how I spotted this winner, and a few interesting notes about this squeeze play.
An Inside Look At How I Used A Simple Pattern To Rake in $12,000 Overnight
I first started watching RH earlier this year, after famed billionaire investor Warren Buffett hopped in. Before I get into the details about the pattern (spoiler alert: I used the TTM squeeze indicator), I wanted to show you what some of Wall Street’s top traders were looking at.
When you’re trading stocks, whether it be small-, mid- or large-caps, the number of floating shares matters.
Why?
Well, that’s the supply that’s available for the market to trade. In other words, it’s the number of shares everyday traders like you and I could buy or sell. Now, if you remember any old economics class… the lower the supply coupled with increasing demand, the price of something shoots up.
If you don’t know anything about finance, I’m going to give you a quick lesson. When a company engages in overt share buying, they are actually reducing the float, thereby reducing the supply in the market.
Now, companies may use share buybacks for a bevy of reasons — but in recent years, we’ve seen share buybacks to artificially increase earnings to boost the stock price. Guess what company did that?
Restoration Hardware. The company used aggressive leverage buybacks and caused the stock to go up 10 fold in just a few years. And you know what else? The CEO was granted stock options on millions of shares, which could only be triggered once the stock price hit certain levels.
If you were the CEO of RH, it would be advantageous to you and investors to conduct share buybacks. Of course, the market was skeptical this would happen. However, RH conducted a $1B buyback and subsequent buybacks. This essentially reduced the float to just around 17M today.
With such a low float and 33% of shares short… I figured this was a prime momentum play.
RH Squeezes, And I Lock In $12,000 In Just 1 Trading Day
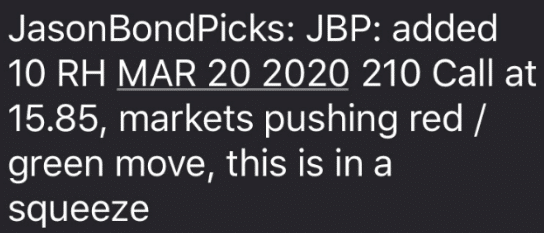
On Friday, Feb. 7, I alerted my Jason Bond Picks subscribers that I was buying 10 RH 210-strike calls expiring March 20, 2020, at $15.85 apiece.
If you’re new to options, each option contract controls 100 shares of the underlying stock, so if you do the math, I paid a total of $15,850 ($15.85 x 100 shares per option x 10 options).
Since I bought calls, it meant that I was BULLISH on RH shares and expected the stock to explode above $210 level by the close on Friday, March 20.
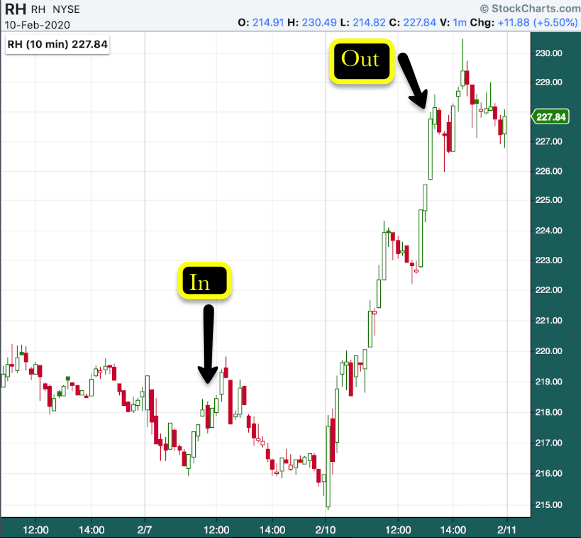
Check out this chart of my play in RH…
You’re probably wondering, Jason, how did you spot this breakout?
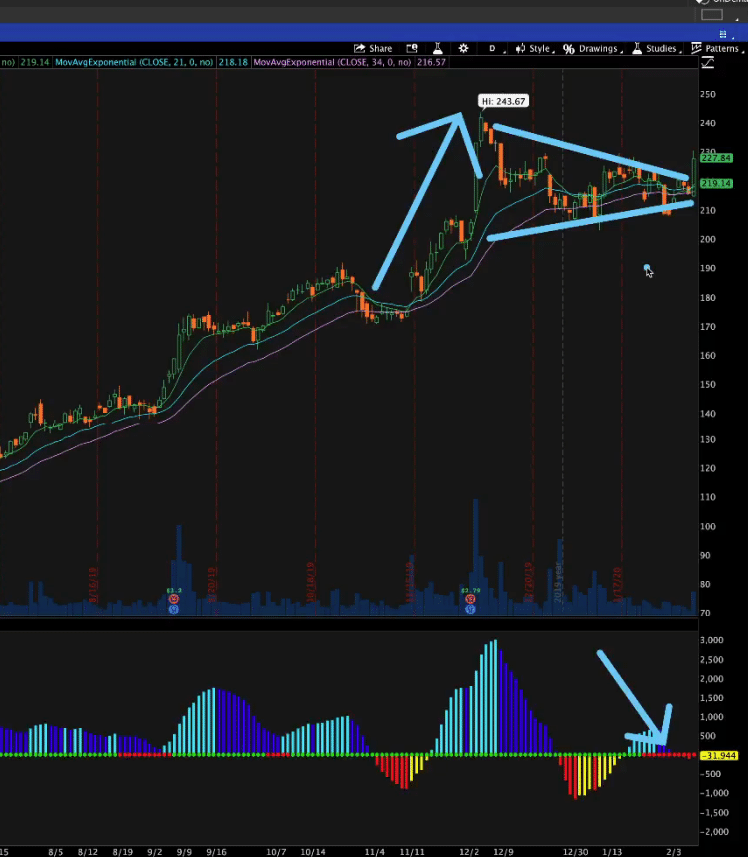
Well, this is where the TTM Squeeze comes into play. It’s really simple and all you need to do is look at a chart. With the TTM Squeeze, the zero line (the line in the middle) is the key to success.
-
If the zero line is red, it means the stock is consolidating.
-
If the zero line turns changes from red to green, it means the stock is ready to move.
-
If the indicator goes above the zero line, it indicates the stock could move higher, and it would be advantageous to place a bullish bet
-
If the indicator goes below the zero line, it indicates the stock could fall, and a bearish bet would be advantageous.
But here, let me show you what I saw in RH.
After the stock exploded and broke above $240, and started to consolidated… the TTM Squeeze indicated RH could make a move. Not only that, but if you look at the chart above, you’ll notice a bull flag/pennant pattern forming.
The TTM Squeeze and the bullish pattern signaled to me the shares could explode and potentially retest highs. However, with the stock price trading above $200… I wanted to use my capital wisely so I decided to play the call options instead.
At the time of my trade, RH stock was trading just under $216.
Remember, I bought these calls on Friday… but the very next trading day… RH shares jumped to roughly $227!
I sold my call options and banked a cool $12K, guys and gals! In less than a full trading day.
That’s the beauty of trading options… and when you focus on simple chart patterns, it becomes very easy to spot winners like this. Sure, there were other reasons to get into RH, but the thing I was most confident in was the pattern.
If you want to learn how to use chart patterns to your advantage and start dominating the markets, then click here to watch this exclusive training session.
0 Comments