Kandi Technologies (KNDI) was one of the hottest stocks amongst Robinhood traders last week.
More than 33K users added the name to their account, thinking it would run higher…
Only to watch the stock pull back and go against them.
You see, there’s one key to being successful when it comes to trading momentum stocks — the ability to identify chart patterns.
Chart patterns let traders know when it may be the best time to enter and exit a position, and it seems to me like a lot of traders couldn’t get the timing right on KNDI.
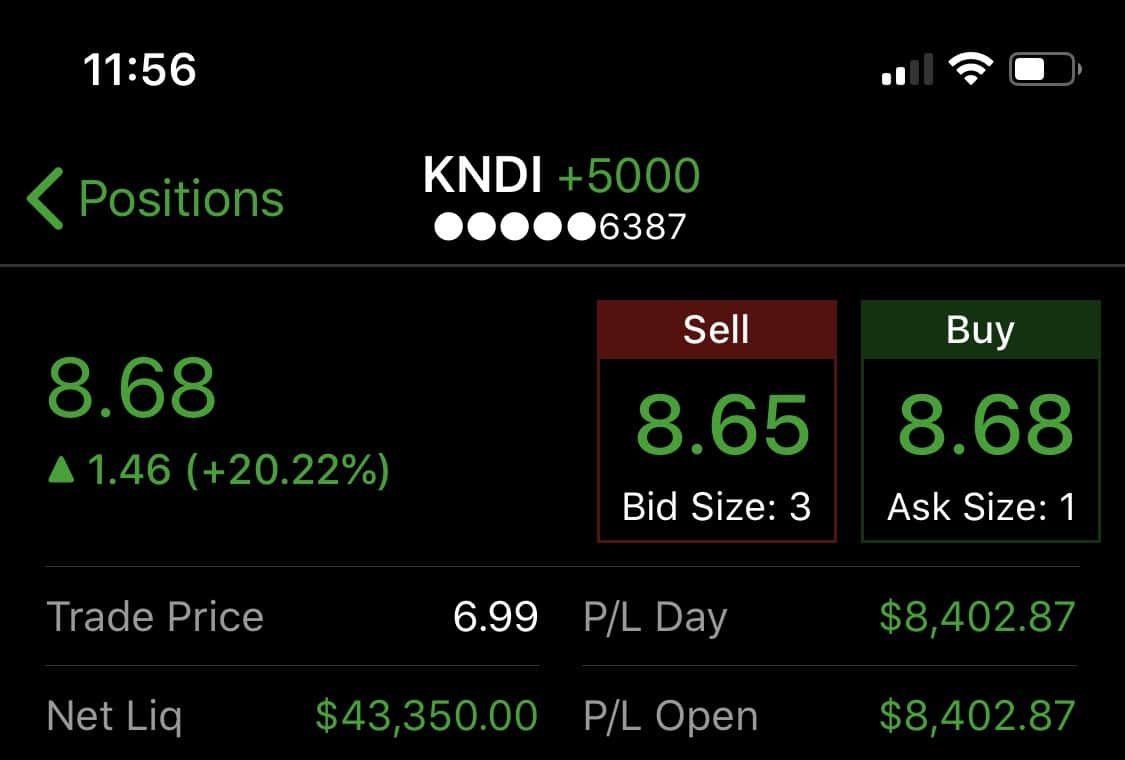
I want to show you how I was able to spot the bounce in KNDI and lock in an $8K winner*.
I believe the pattern I used to spot this winner in KNDI is perfect for this environment and can prevent traders from buying tops.
So what pattern am I referring to?
Use This Tool Before You Think About Chasing Momentum Stocks
Here’s what I sent out on Monday, letting my subscribers know KNDI was in play.
KNDI is a retracement play I’m watching. Like it above $7, stop below $7, goal 10-20% on a swing. Catalyst now comes into play for a possible uptrend into the event. I don’t expect a break of the recent high but do think it could trade up or worst case, trade sideways, as long as they don’t raise money.
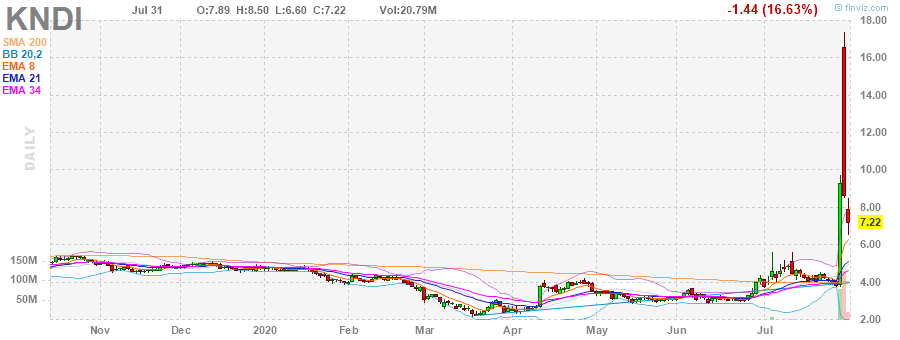
The stock pulled back from a high of $17.40…
And I believe a lot of traders actually chased momentum, thinking KNDI could run higher.
There’s actually one tool that lets me know when’s the right time to get into a stock after it’s pulled back.
It’s known as the Fibonacci retracement tool.
This lets me know where there are key levels that can act as support and where the demand can pick up.
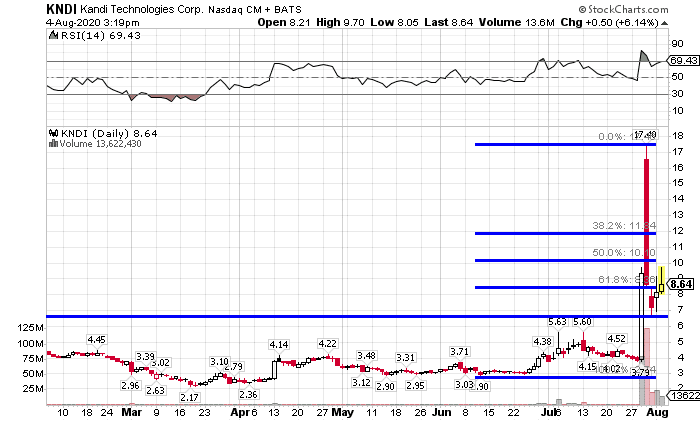
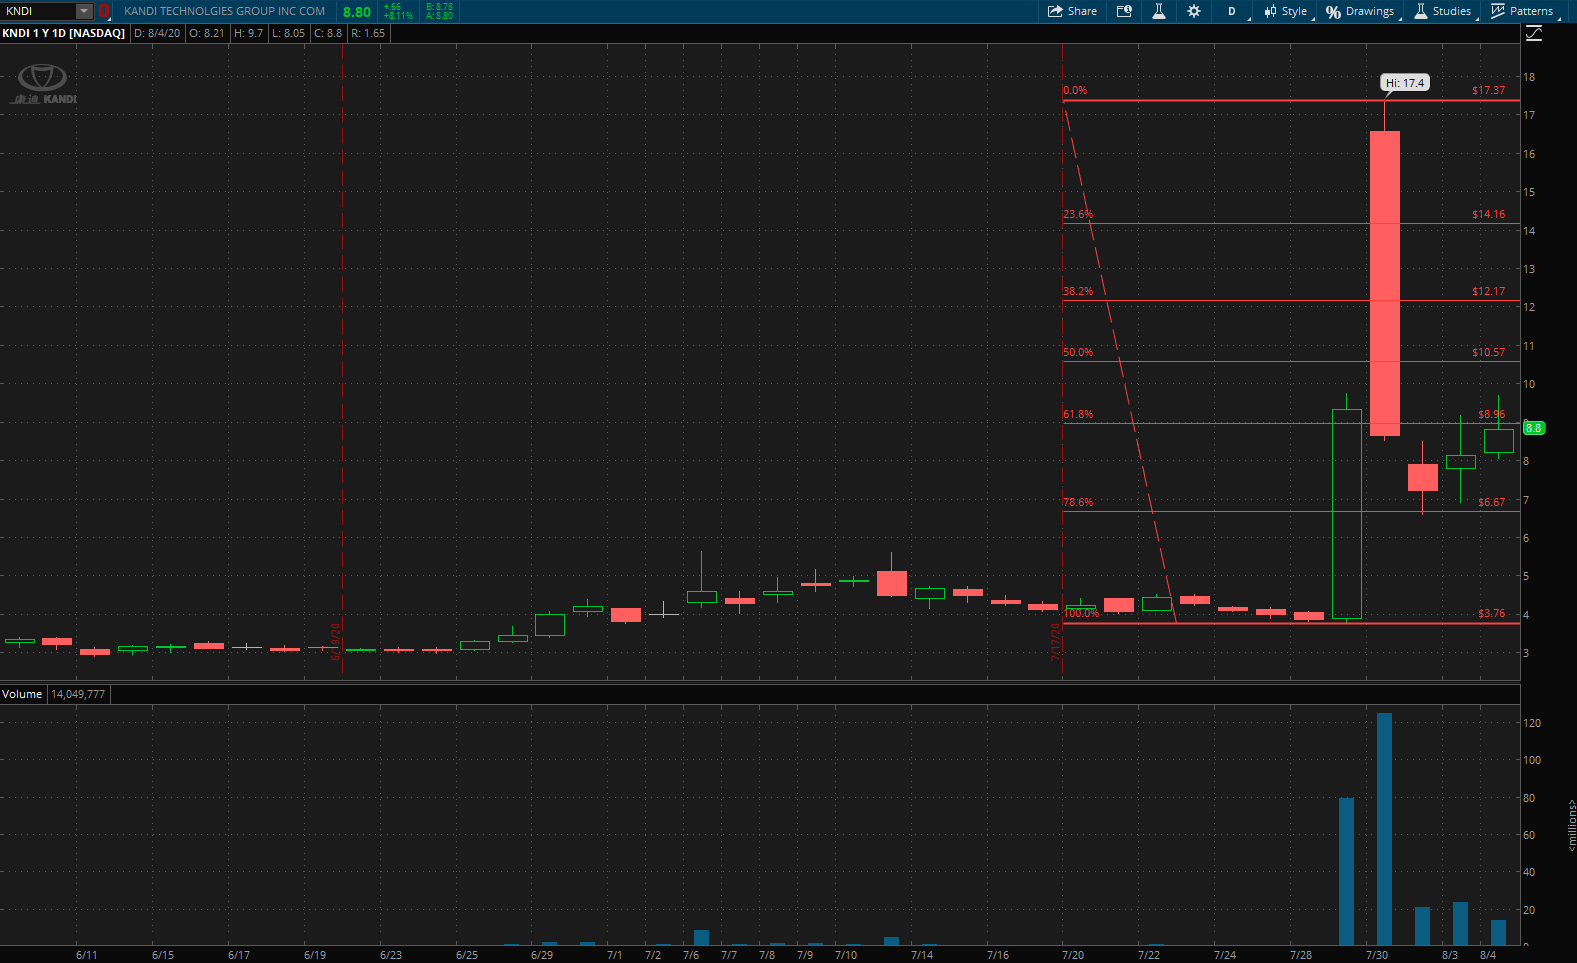
With KNDI, it broke below the 61.8% Fibonacci retracement level, but there is actually another line of defense there… the 78.6% retracement level.
This was right around the $6.75 area.
I figured there would be buyers around there and it would be a perfect entry.
Depending on your broker or charting platform, there should be a setting to add where you can show the 78.6%, as well as 23.6% retracement levels.
On thinkorswim, it should show up as the default.
What I waited for was a break above $7 because that’s an indication it was a key support area and had a high chance of holding.
Typically, when a Fibonacci retracement level holds, it’s likely it can make a move.
With KNDI, I was looking for a 10-20% move…
That 78.6% retracement level held up well, and KNDI made the move I expected.
With the Fibonacci retracement tool, it helps to identify areas of entries and exits.
For example, you could’ve bought right around the 78.6% retracement level and sold around the 61.8% retracement level.
This pattern is especially powerful in this environment when momentum stocks are having wild moves.
The thing is, this is just one of the patterns I utilize to attack the market.
If you want to learn more about the techniques I use to uncover momentum stocks before they move…
Then make sure to grab a copy of my latest eBook.
What you’ll learn may shock you and can be a game changer if you want to hunt down momentum stocks set to move.
*Results presented are not typical and may vary from person to person. Please see our full disclaimer below.
0 Comments