Cannabis stocks have fallen out of favor, and many have been demolished this year so far.
However, we saw signs of life recently when Canopy Growth Corp (CGC) and Tilray (TLRY) caught a pop.
With an upcoming election and debates, I believe cannabis stocks will be a focus… and the demand could start to pick up. Traders may look for some action and anticipate positive news in the space.
I wouldn’t be surprised if there is actual news that comes out and lifts a lot of these stocks… or positive news about a specific company’s earnings comes out and raises the tide.
There is one cannabis stock that looks very interesting to me right now.
One of my favorite patterns is showing up in it, and it’s pulling right into a key support level.
To me, I see it as an area of value.
So which pot stock am I watching now, and can it bounce?
One Of My Favorite Patterns Just Showed Up In This Pot Stock
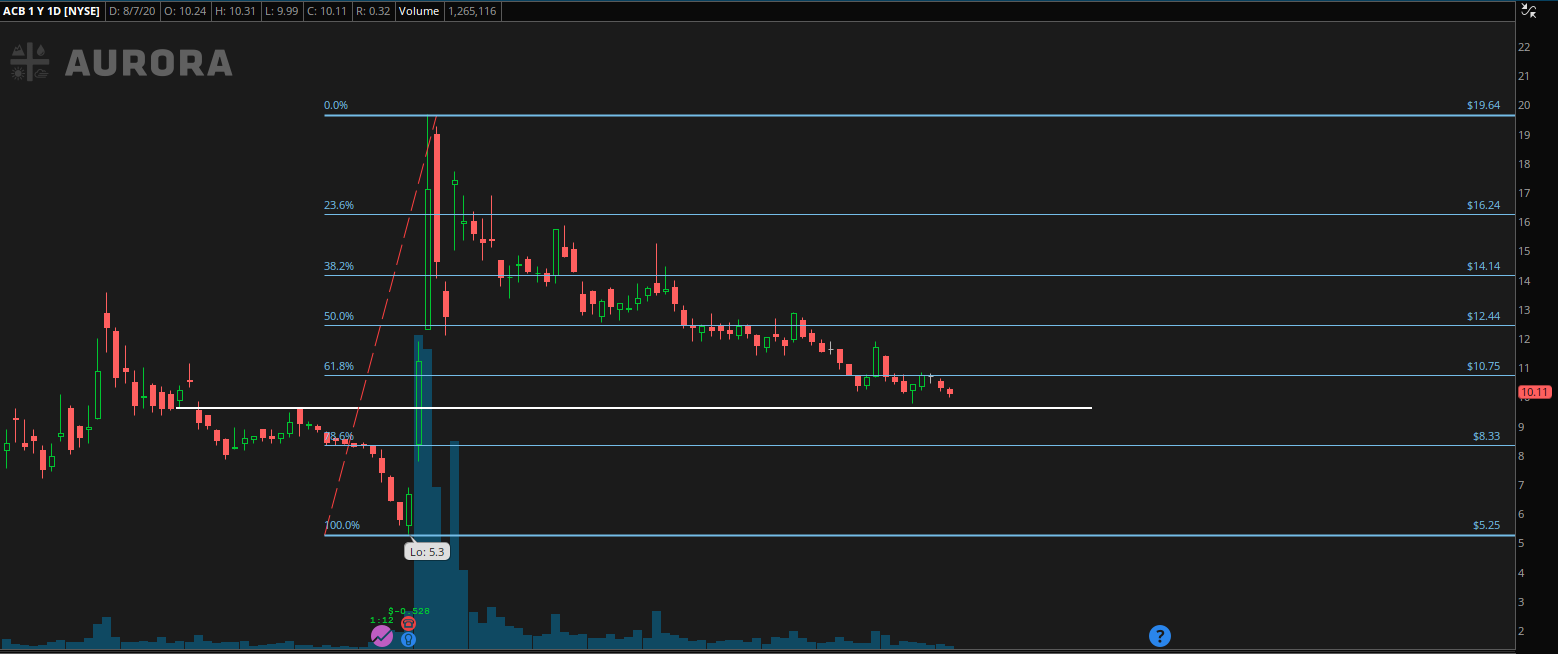
Check out this daily chart in Aurora Cannabis (ACB).
Just a few months ago, ACB made a move from just about $5 to $20 in a matter of days. However, since that move, it’s been pretty beaten down.
So why am I keeping ACB on my radar right now?
Source: thinkorswim
Notice those lines I drew on the chart?
Those are Fibonacci retracement levels.
These areas help to identify key support and resistance levels. Keep in mind, they don’t follow this to perfection all the time and it’s more of an art form.
I’ve been following these patterns for years, so I know when may be a good time to look at these. With ACB, it actually broke below the 61.8% retracement level, a key area…
And right now, it’s sitting around a key inflection point at $10.
This would be considered an area of value to me. However, I don’t want to jump the gun and would rather be a little more patient and see what it does here.
The beauty of this chart pattern is it allows traders to plan ahead of time… so that takes the emotion out of trading.
With ACB, I want to focus on the white horizontal line in the chart above, if it holds above that and breaks above $10.75 (the 61.8% Fibonacci retracement level), I may be inclined to start a position in the stock.
However, if it breaks below, I would wait until the next line of defense at the 78.6% Fibonacci retracement level because that would be a key area of support.
Since the company is set to report earnings in September, it can runup into the event, and that’s why I want to keep it on my watchlist.
This is just one of the many momentum stocks that I’ve been able to uncover for a potential trade utilizing my chart patterns.
If you want to make trading easier and look at charts to develop trade ideas, then you’ll want to check out my latest eBook, Wall Street Bookie.
Inside, you’ll find real-money case studies, and the same techniques I use to hunt down momentum stocks before they move.
Click here to claim your copy.
0 Comments