Stocks experienced the fastest correction on record… ever. It came out of the blue, and it’s typically the punch that catches traders off guard that puts them out. For many market participants, it’s about survival and not returns right now.
However, as a trader, I know this is the time where opportunities present themselves… and fortunes can be made. Today, I want to show you one pattern and how to find stocks to trade — putting you in a position to profit.
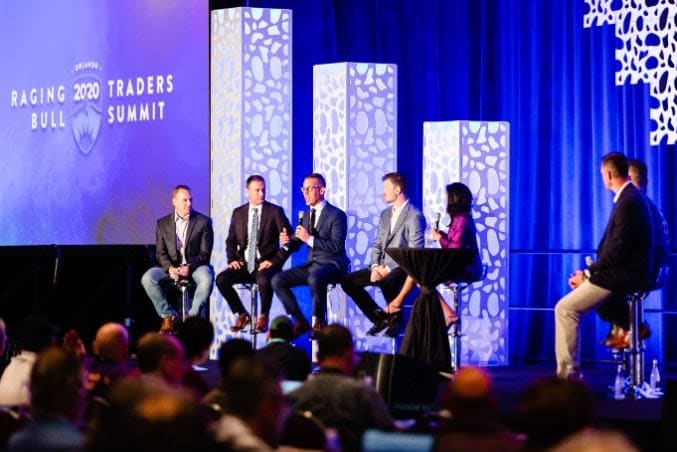
I haven’t established any new positions in Jason Bond Picks just yet, I’ve just held onto some positions. I was busy on Monday and Tuesday at the RagingBull Traders Summit, and I decided to stay with my family in Orlando… just to avoid the whole bloodbath.
Man was I glad I didn’t throw down massive bets and try to buy the dip. I’m ready to get back on the saddle this week… and I will be on the hunt for one of my favorite patterns that has proven to work well during market selloffs.
So what’s this pattern and how can you filter for it?
How To Fish For Monster Profits During Market Selloffs
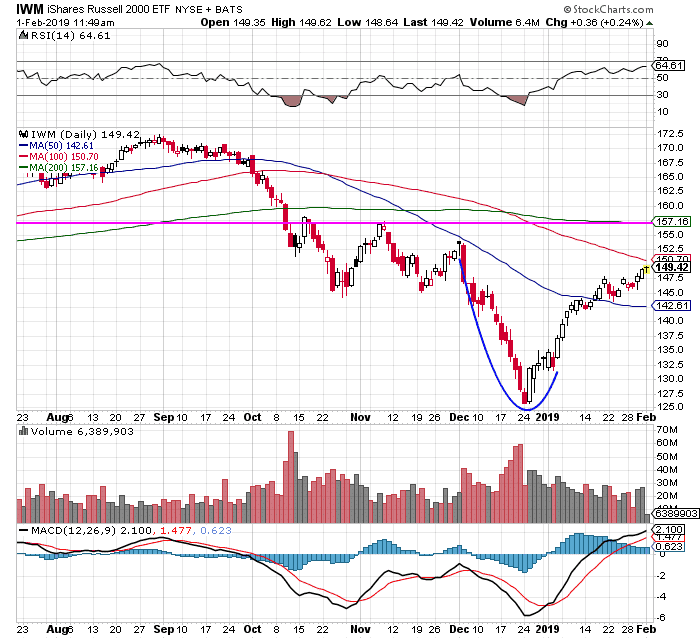
This market correction is very reminiscent of the bloodbath in December 2018, which spilled over to January 2019… and that was one of my best months trading…
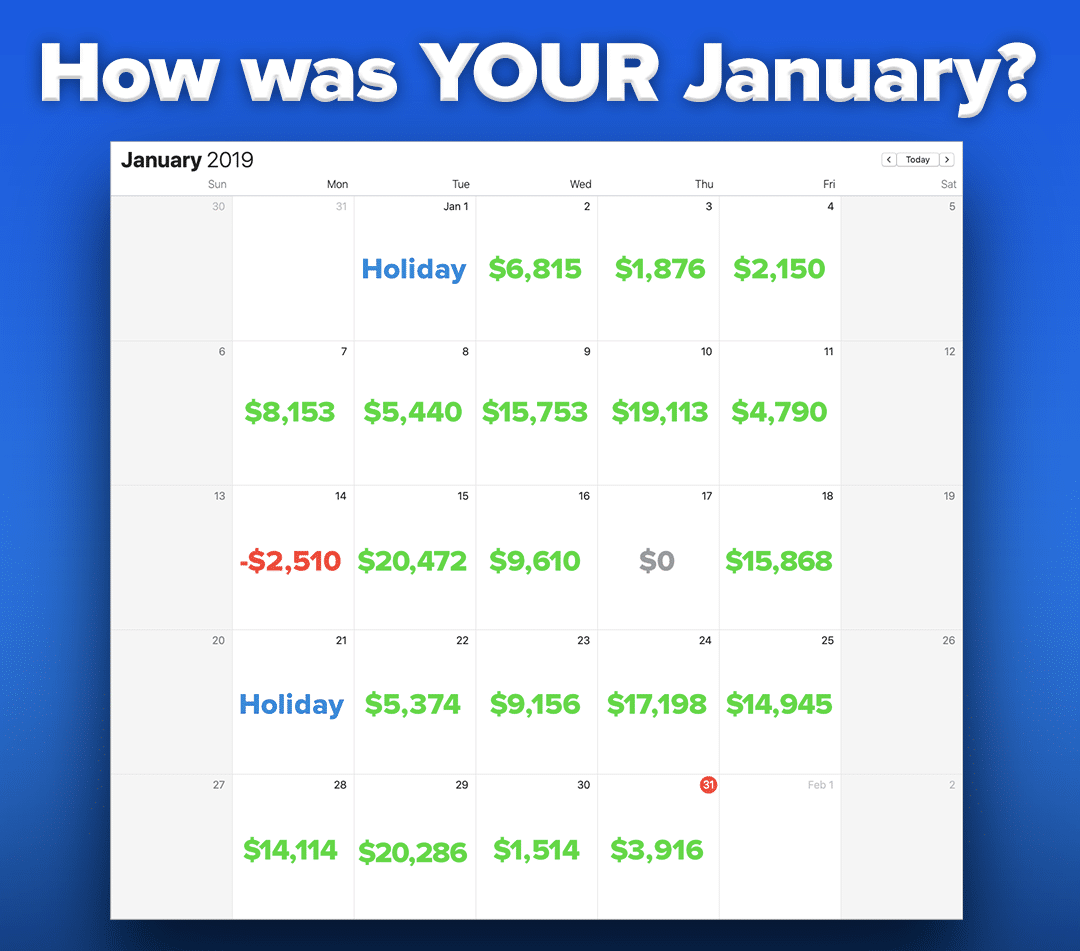
I went back and reviewed my trades — I found a few patterns that helped me crush the markets and navigate all the volatility in 2019. I think I could replicate that success and potentially do better.
You see, since then… I’ve added a few different strategies to my bread-and-butter setups. Rather than solely focusing on small-caps, I’ve expanded my trading universe to mid- and large-caps. Keep in mind, I’m using options to hunt down momentum in mid- and large-cap stocks.
Let me show you a quick filter to find stocks to potentially trade.
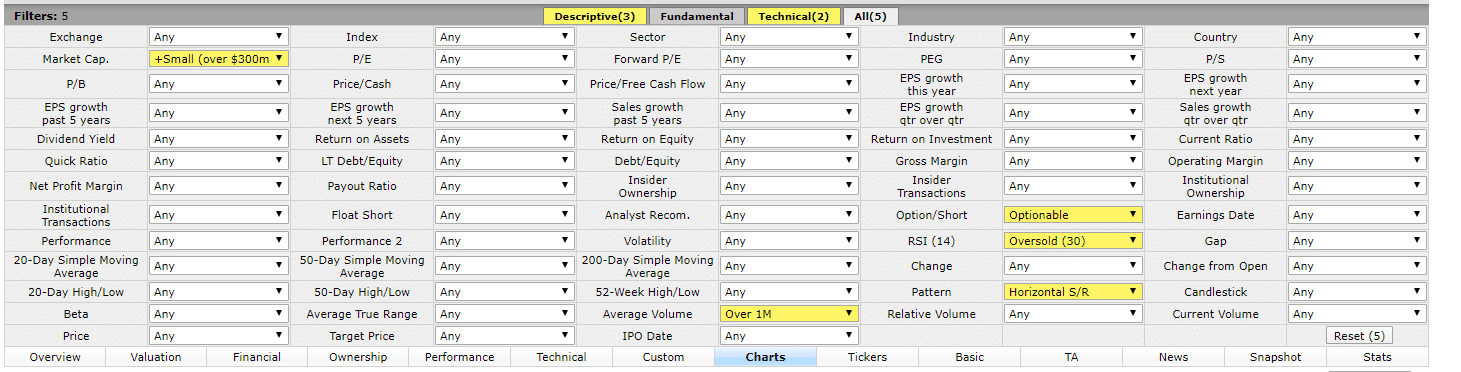
With the Finviz Screener tool, I simply filtered for:
- Market Cap. I want to look for stocks with a market cap greater than $300M, mid- and large-caps included.
- Average Volume. I filtered for “Over 1M” here because I want to find liquid stocks.
- RSI (14). With this specific filter, I want to find oversold stocks ripe for a rebound.
- Optionable. You could choose to use or not use this, but I do want to look for stocks that have options to trade.
- Pattern. It helps to find stocks at a support and resistance line.
Once that’s all done, I look at the “Charts” view.
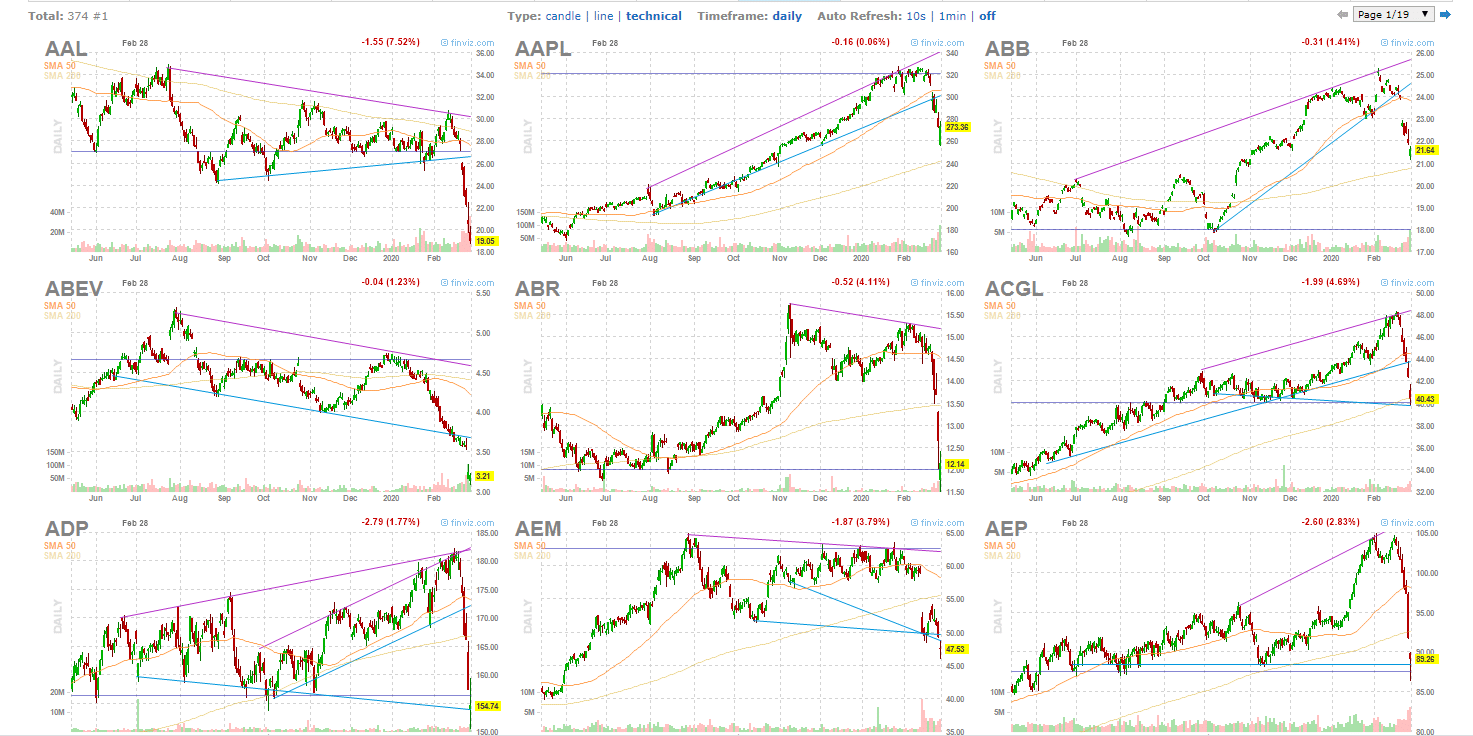
Since I know exactly what I’m looking for… it’s pretty simple.
Basically, I’ve trained myself to look for oversold stocks exhibiting the fish hook pattern. All we’re looking for is a sharp move down… followed by a pause (where the stock finds an area of support)… then a quick bounce higher.
Here’s the exact pattern I’m looking for…
If you notice, this pattern really looks like a fish hook… and if you think about it, this may be the prime time to look for fish hooks.
One stock that sticks out to me right now is Restoration Hardware (RH).
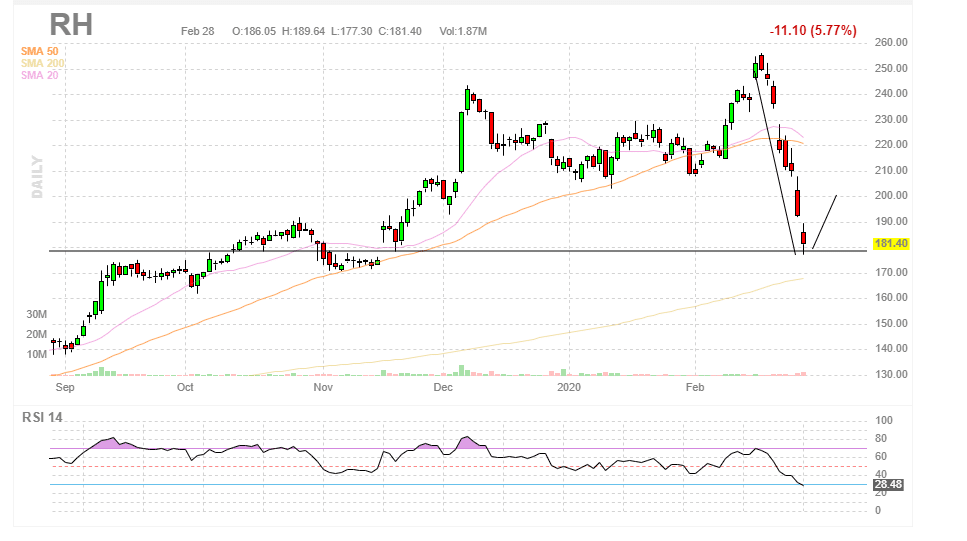
It’s showing signs of a potential fish hook pattern, and there is a catalyst on the table, as Warren Buffett has a stake. The thing is, I won’t really be looking to buy shares of expensive mid- and large-caps… because that would just eat at my buying power.
Instead, I’ll use options as an alternative to not only leverage my capital but properly allocate risk to my trades.
If you’ve been having a hard time surviving in this market environment… don’t beat yourself up, because it’s going to be a new trading week — and I believe there will be plenty of opportunities for my fish hook pattern to reel in.
Thank you that the basic teaching continues over and over need to get this material into the brain matter over and over . Great learning at the Orlando conference and thank you so much for your generosity of food, books and money that was fun.
Thank you for this information, especially about being able to filter for stocks showing this pattern. All of my cash is tied up in stocks right now, so I have very little to play with, unless I sell some off, which I have been doing some lately and buying some options. I have had very little success with Options though as a beginner, buying Puts when it should have been a Call and vice versa! I don’t have the funds to play big right now by buying more than one contract at a time to make bigger gains, but I am slowly learning. In Dec-Jan, I knew nothing about trading stocks!
RH has 30% short float. Current price $185. Closed @ $181.41 on Friday. Reports on Mar 26. Ripe for a short squeeze. Yes, it could drop more next week. Obviously options are expensive. Mar 20 $185 Calls B/A is $12.10/$14.80 based on Fridays close. Delta 0.53 means the Ask will be ~ $16.75 on Monday morning. Looks good!
Thanks Jason-looking for more info on RH
Hello Jason,
Thanks a lot for giving everyone your support at refreshing up our minds about these smart strategies,especially this coming trading week.Your timing is perfect because i am positive
that the market will do a 180 degrees and watch out the rocket is ready for take off, finally
You are a Genius.