Stocks got rocked yesterday as news broke that the coronavirus continues to spread widely outside of China. There continue to be rising cases in Italy, South Korea, and Iran — causing traders to wonder whether corporate earnings will get decimated.
The Dow erased all of its gain for 2020 and posted its third-largest decline in history, while the S&P 500 dropped 111 points (about 3.35%), and the Nasdaq declined 355 points (about 3.70%). If your trading account took a hit yesterday, don’t fret because I’ve got you covered.
Today, I want to show you how you can trade market selloffs — heck, any market environment — with ease and still remain a bull in this market environment.
You see, you don’t necessarily have to panic sell your positions just because the market dragged it down. Instead, you can still look for profit opportunities by identifying strong stocks or spot dip-buying opportunities.
How To Find Profit Opportunities In Weak Markets
Warren Buffett said it best, be “Fearful when others are greedy and greedy when others are fearful.” This plays true when the market sells off, and if you look at all the great investors and traders of our time, they use a contrarian approach.
What I mean by that is they don’t play to the herd mentality and just sell their positions because everyone else is. In fact, they may actually be waiting for the right time to buy the dip.
You see, when the market sells off as it did, stocks actually get cheaper… and once the market turns higher, it could drag those beaten stocks down with it. So I want to show you a quick way to scan for stocks ripe for a potential dip-buying opportunity first.
I’m going to use Finviz and show you three simple filters.
Now, I won’t just be looking for small-cap stocks to trade, in fact, I’ve expanded my horizons and look for mid- and large-caps to trade as well.
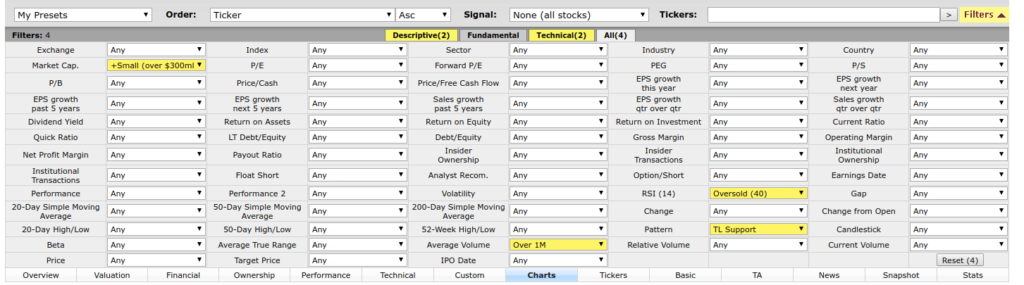
Check out the quick scan I created above. I want to look for stocks with a market cap greater then $300M (this widens our net and allows us to fish for some of the best opportunities out there).
Next, I want to trade liquid stocks so I look for an average volume greater than 1M. Thereafter, I head right into the technicals.
For now, I think focusing on oversold stocks with a Relative Strength Index (RSI) below 40 can help us uncover dip-buying opportunities. Why?
Well, generally, when we see the RSI below 30, it’s a signal the stock could start to turn higher, especially if there’s a pattern to go along with it. So rather than waiting until after the fact, I want to stay one step ahead of the game and keep some stocks on my watchlist.
In times like these, it also helps to look for stocks still in their long-term uptrend because that could act as a support level. Luckily for us, Finviz makes it easy for us to scan for this pattern… all I have to do is filter for stocks with “TL Support”.
Pretty simple, right?
Once I get my trading universe down, I’ll look through charts to see if they exhibit my favorite patterns… and I may either look to buy options or the stock outright… and I may even look to sell options premium to generate income.
If buying dips isn’t your game… there’s another way to filter for profit-making opportunities…
Hunt Down Stocks That Don’t Move With the Overall Market
If you look at the heatmap from Finviz yesterday (for the S&P 500), you’ll be hardpressed to find stocks that were green.
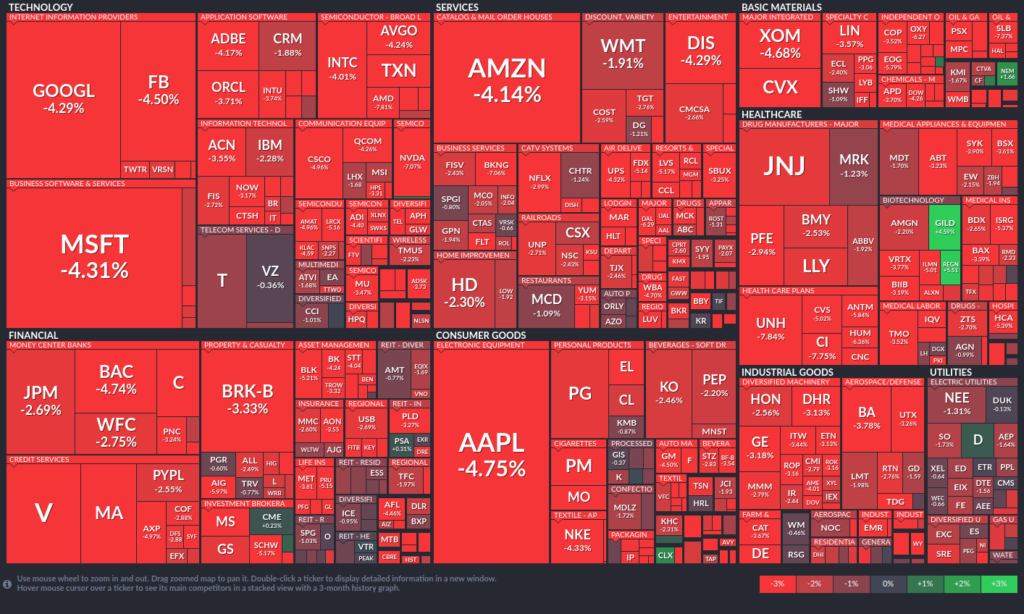
However, the ones that do come up indicate they are relatively strong against the market… and if I can spot the right ones, it could improve my odds of success.
Why do I say that?
Well, if a stock is up on a day when the entire market is plummeting… what do you think would happen if and when the market turns?
It would shoot up, right?
I know you’re probably wondering, “Jason, how do I actually find these stocks?”
It’s simple, continuing with Finviz again, all I did was tweak the filters a bit. This time, I want to look for stocks up on a day when the market is plummeting.
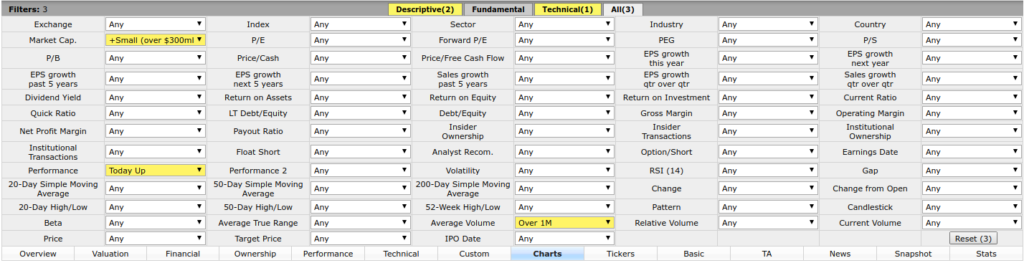
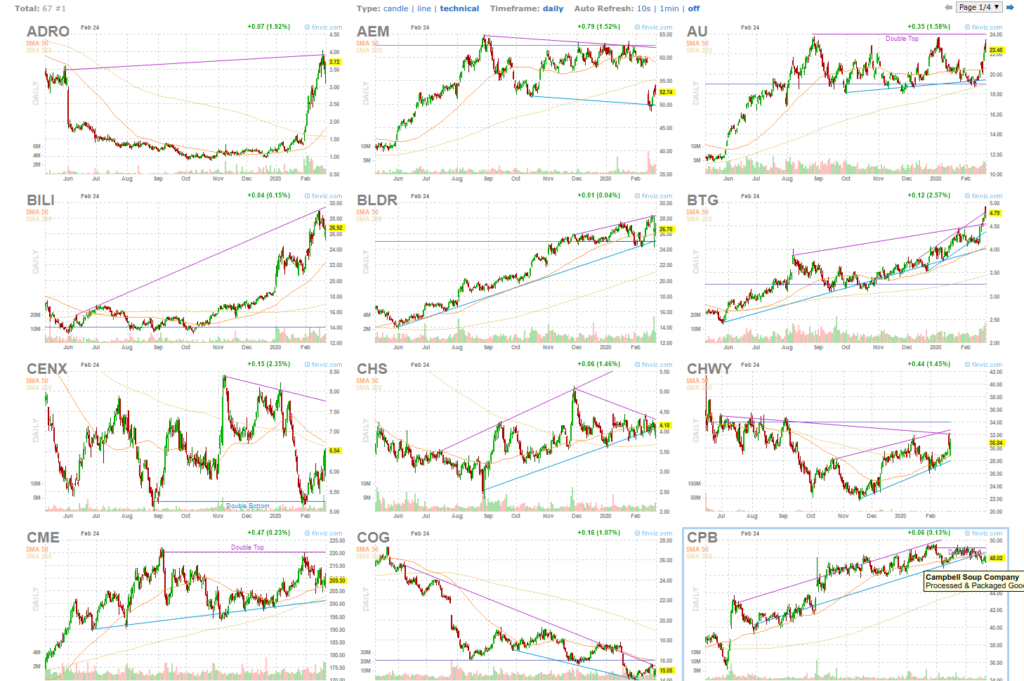
Just by using this scanner, I’ve filtered down my trading universe down to about 65 stocks. Thereafter, I look at the chart view and see if there are any chart patterns that stick out.
For example, one stock I am currently long in my Jason Bond Picks account is Overstock.com Inc. (OSTK). To me, this stock looks strong because the market didn’t drag it down with it… and my pattern signals it could rocket higher.
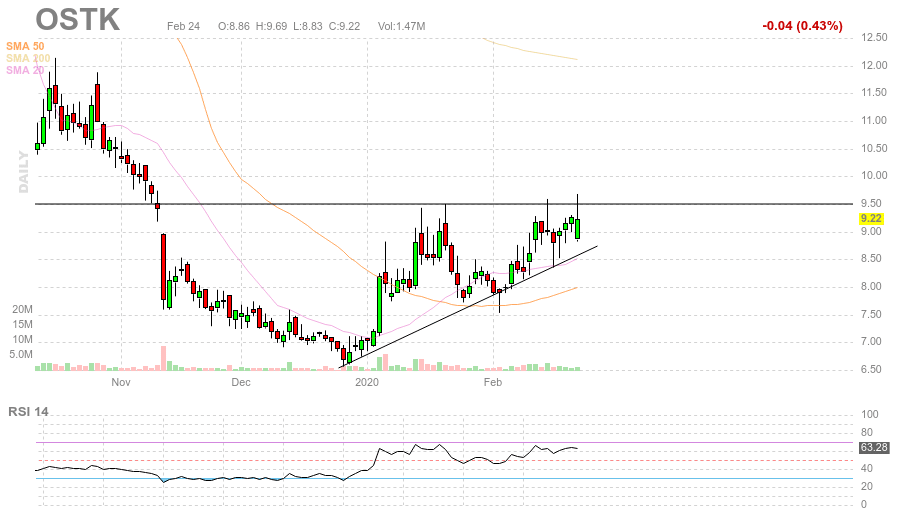
Right now, OSTK has an ascending triangle pattern, and if it could break above the key resistance level (the horizontal line in the chart above), I think OSTK could build momentum and continue higher.
It’s really that simple. The key takeaways here are to remain patient and not follow the herd, at least that’s what I’m doing. Find oversold stocks, as well as stocks not correlated to the overall market, with a bullish chart setup.
0 Comments