… an oversold condition.
Watch this video lesson to learn about my favorite chart pattern, the one I make a lot of money on over and over.
Then down below I share my core video lesson.
The video lesson I built this business on.
The video lesson I’ve made +100% +$40,000 on in just 3 days time.
For HD 1. Play 2. Select 1080p 3. Expand
1. A condition in which the price of an underlying asset has fallen sharply, and to a level below which its true value resides. This condition is usually a result of market overreaction or panic selling.
2. A situation in technical analysis where the price of an asset has fallen to such a degree – usually on high volume – that an oscillator has reached a lower bound. This is generally interpreted as a sign that the price of the asset is becoming undervalued and may represent a buying opportunity for investors.
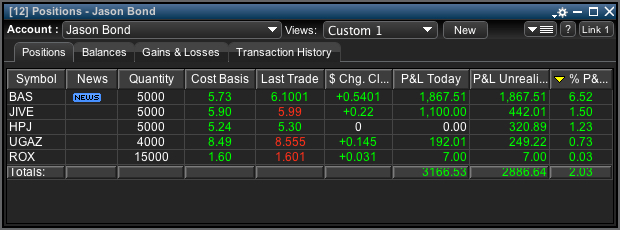
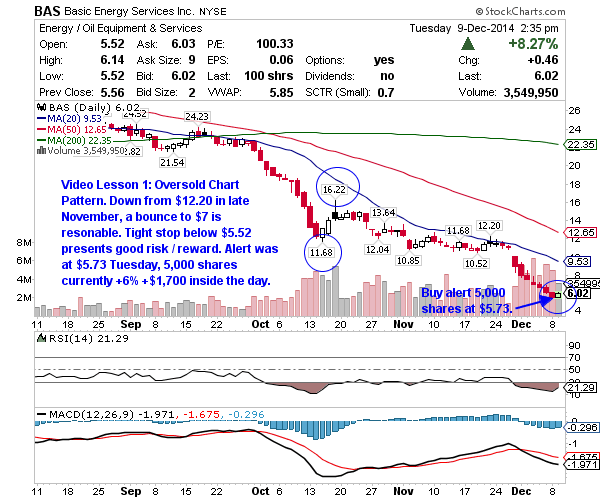
So today I alerted a swing on BAS buying 5,000 shares at $5.73 and am already +6% +$1,717 on the trade.
Here’s what today’s swing trade alert on BAS said.
“Good Morning. Here’s one that just came up when I ran a fresh oversold scan. It’s not on today’s watch list but has good news and is deep into oversold. Bought 5,000 BAS at $5.73. My stop on quote is under $5.50 here. This is straight from video lesson 1: oversold chart pattern so be sure to view it if you don’t already know it. The news is a good catalyst and I also think there’s a good chance oil guys bounce for a few days here. BAS is a nice one that is a service play and NOT a producer. It’s been cut by 75% lately. The heavy volume selloffs past few days give this a lot of support too. Your Swing Trader.” ~ Jason Bond.
I apply this strategy almost every week. Study this blog post too because it couldn’t be more clear and will help you – here’s how I made +100% +$40,000 in 3 days applying the same pattern.
Now watch my core video lesson: oversold chart pattern.
For HD 1. Play 2. Select 1080p 3. Expand
This was a good one. My fave is oversold scans as well. One thing of note though is that when you say “watch out for offerings”, it’s unheard of to know of them in advance. So there’s always that chance that you’ll be in a position swinging and get a nasty rug pull. As you said, small caps carry many risks and this is but one…..