The opening bell is right around the corner, and futures start trading in just a few hours — and I’ll take a look at what the overall market is doing and start to game plan from there.
For the most part, most of my analysis will be done before the opening bell tomorrow morning. Today, I want to show you my process to uncover potential momentum trading opportunities for the week.
If you don’t already know, on Monday mornings, there is typically a lot of price action in specific momentum stocks. More specifically, there are stocks gapping up — so how do I scan and filter these names to just a handful?
[Revealed] My Process To Uncover Momentum Trading Opportunities
Of course, there are thousands of stocks out there to potentially trade… and if you just look at momentum stocks, it could be hundreds. Now, I don’t really want to look through hundreds of momentum stocks because it can be very noisy… and nearly impossible for me to sift through those in just a few hours.
Instead, I use a filter. For the most part, I’m sticking with small- and mid-cap momentum stocks.
The more important factor here, in my opinion, is liquidity.
Why It’s Important To Filter For Liquid Stocks
You see, in the early morning session, stocks can be gapping up significantly in the pre-market session… but if you delve deeper into that specific symbol, you may notice there’s only a few hundred shares traded, which is not liquid to me.
Now, many traders tend to look at the number of shares traded (volume), but I don’t believe that actually gives a clear view of the actual liquidity. Instead, I like to look at dollar volume ($ volume).
You may be wondering, “Jason, what’s dollar volume?”
Well, it’s calculated as the number of shares traded by the price they were trading at. For example, if a stock trades 1M shares with an average price of $5.00, then the $ volume would be $5M.
You see, when you compare the actual trade volume, it really doesn’t help me all that much.
For me personally, I like to filter by $ volume of at least $200K in the pre-market trading session. Thereafter, I like to sort by percentage change (% change) for the day.
Here’s a look at how I filter for stocks to potentially trade.
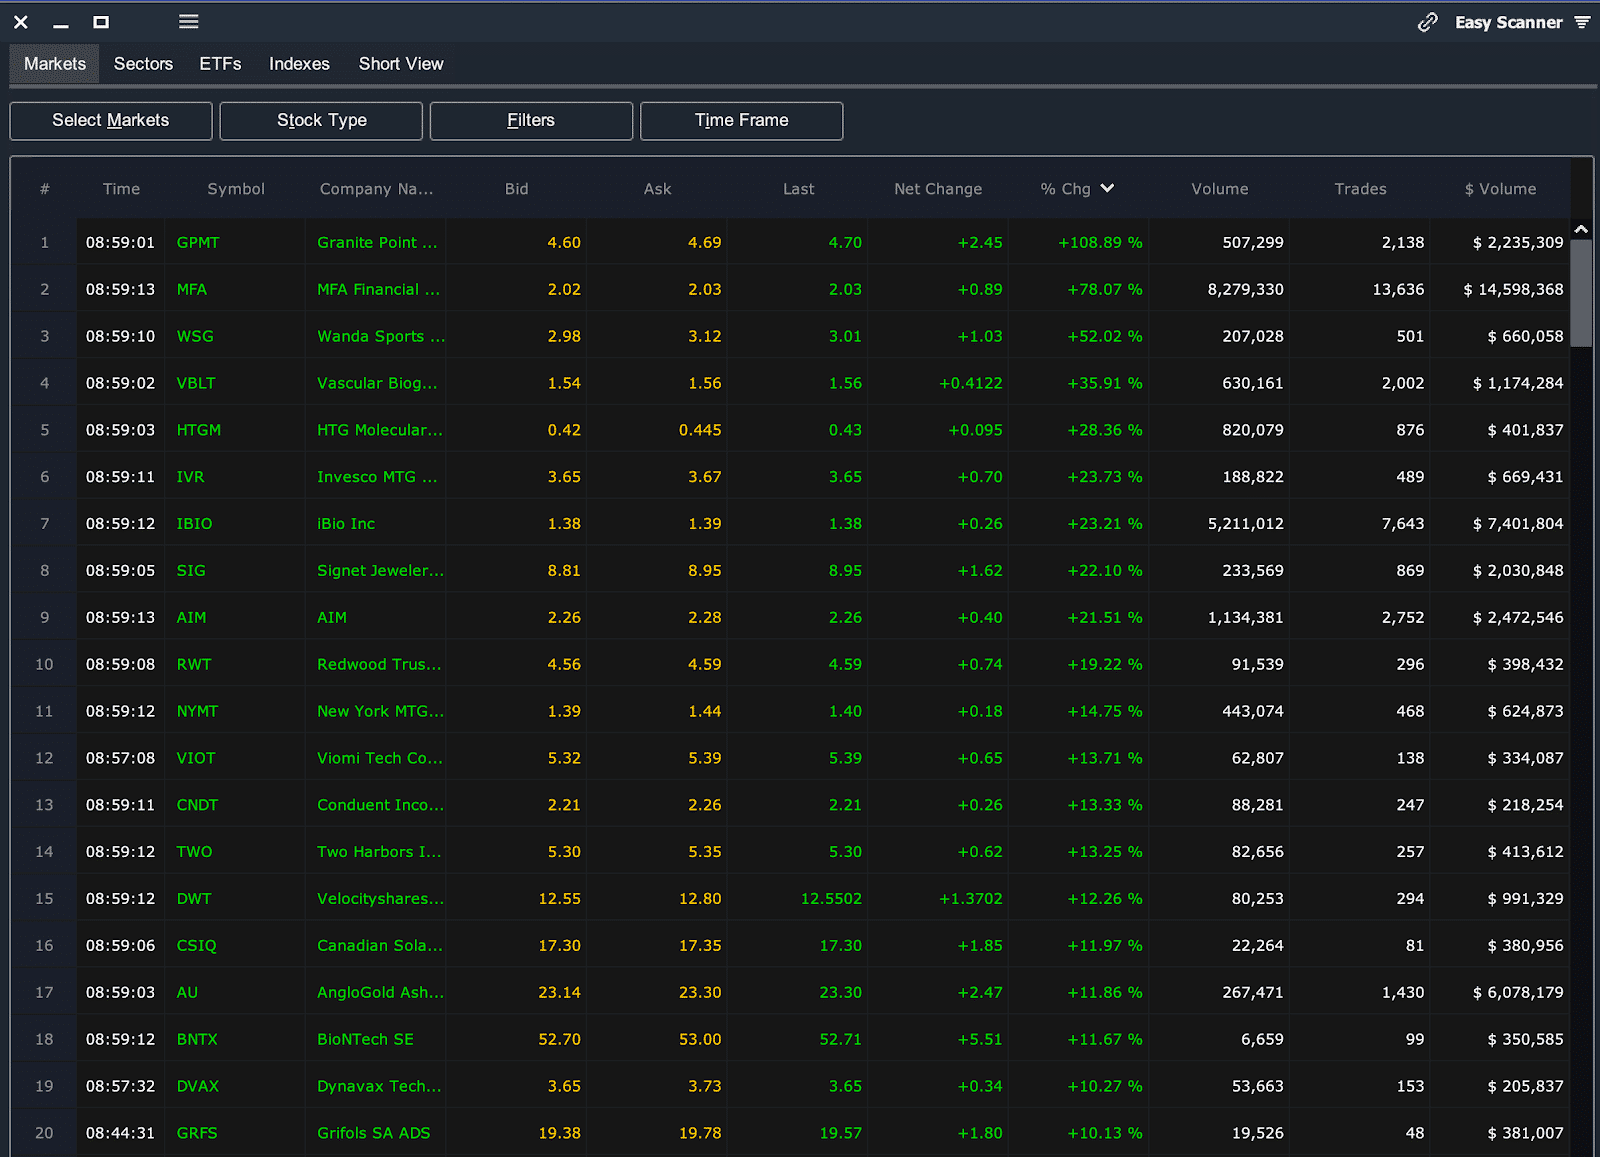
Source: Scanz Technologies
In the above filter, I filtered by stocks with at least $200K in dollar volume, and I just sorted by % change. Thereafter, I look at the charts for the top 20 or so names. If I see one of my bread-and-butter setups, I’ll put it on my watchlist and develop a game plan.
By filtering for these stocks, I can actually get a better view of which momentum stocks can actually move for that specific day. However, once the opening bell comes around… I change my filter.
I actually increase the $ volume filter to stocks with at least $2M in liquidity. Basically, this gives me an idea of what momentum stocks can continue higher.
Now, this will be the process I’ll be using come tomorrow… and I’ll be sure to let my subscribers know about any momentum stocks that I believe are poised to rise.
If you want to learn how I’m able to spot some of the hottest momentum stocks set to move, then check out my momentum trading masterclass.
You are an excellent Teacher and a “Genius Trader” , Jason. You are an invaluable asset to Raging Bull. May God Bless You and your Family.