Well, it looks like the “buy the dippers” took control this week — as IWM, QQQ, and SPY finished the week up by 5.77%, 5.70%, and 3.41%, respectively.
Will this price action continue next week? Who really knows, but by the looks of it — stocks can continue to march higher.
Right now, I’m looking forward to the next week… and I’ll look to my scanner to uncover momentum stocks poised to run come Monday morning.
There are some stocks on my master watchlist that I’ll be looking for potential entries in… but when it comes to momentum stocks, I believe having an exit strategy is just as important as knowing when to get in.
Today, I want to show you how I plan my targets ahead of time… and reveal how I uncovered a $5K winner in Sientra Inc (SIEN).
How I Uncover Areas Of Value To Take Profits
When it comes to momentum stocks, they can move very fast… and if you don’t have a plan, things can go against you very quickly. That’s why I believe it’s imperative for traders to know where they want to get in, take profits, and stop out in case things go against them.
For me personally, I like to look at the charts to find key levels. Basically, they’re areas where I think I should be getting in, stopping out, or taking profits.
Of course, it helps to understand the inner workings of some commonly used chart patterns.
Let me show you one momentum pattern that I believe it’s important to keep on the radar.
The “Rest And Retest” Pattern
Last Friday, I let traders know SIEN was on my radar. Now, the previous week, I spotted SIEN and was able to lock in a $4K winner.
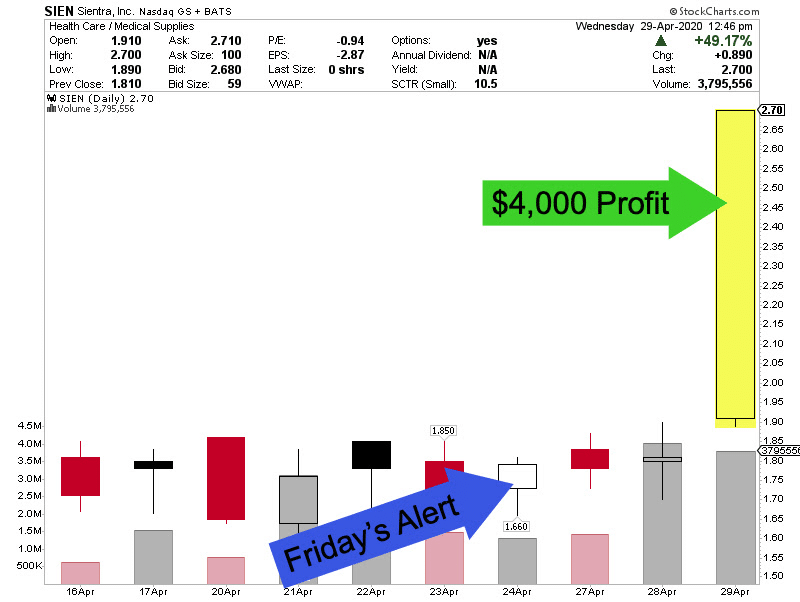
Chart Courtesy of StockCharts
With momentum stocks, I like to keep them on my radar even if I’ve already made money in them.
So here’s what I sent out to my subscribers on May 1…
Now that SIEN has had time to rest in the low $2’s, I’m likely to buy it again before the close in the $2.20’s but no higher than the $2.30’s for me. This up, in, up again pattern is showing some signs of spiking Friday on the intraday chart. Probably some short cover but I also think this is a pretty good company, so I like taking shots when the price action appears frisky. Keep in mind, it is not uncommon for me to trade the same stock over and over if it keeps presenting what I believe to be good opportunities and this is one of those cases.
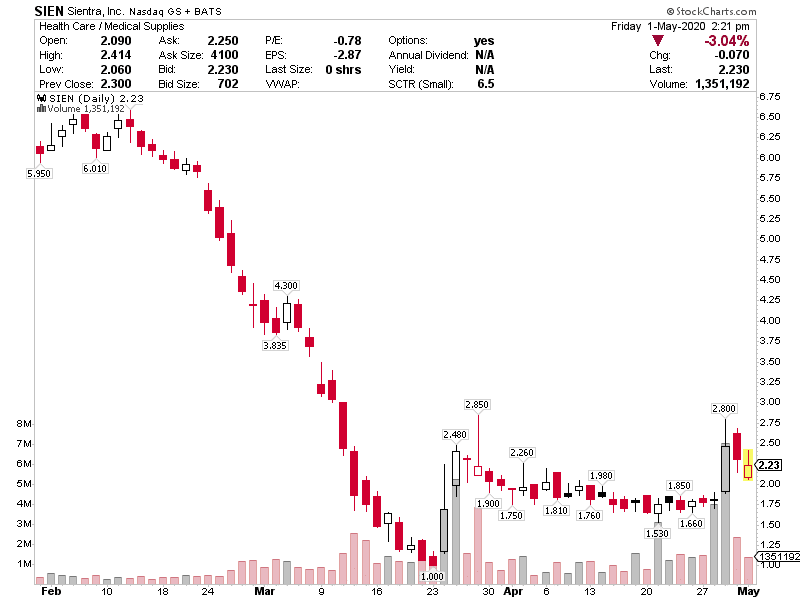
Chart Courtesy of StockCharts
Stop loss for me on this is around $2, goal is 10-20% but of course I always hope to get lucky and catch some good news.
Now, my stop-loss here was at a support level. Basically, I believed if SIEN broke below $2, it had room to drop another 50 cents, so I wanted to avoid the potential drop if the stock moved against me.
I bought 10K shares of SIEN at $2.37 on May 1 at 3:35 PM and planned to hold into the weekend.
Of course, the move I was expecting didn’t happen right away.
In fact, I had to wait a few days for the move… but I noticed an area where I could add to my position.
Here’s what I sent to my subscribers… letting them know I was planning to buy more.
SIEN between $2.50 – $2.60 continuation to $3, maybe higher, is what I see here. I’m looking to add 10,000 shares of SIEN this morning in that zone and will take profit in the upper $2’s if I’m right. I’m already up $1,700 here but the pattern looks strong and I think I have a good chance of getting profit in that zone.
Here were my actual moves in SIEN.
Added 11,400 SIEN at $2.62, average is 21,400 at $2.51. Up nearly 10% already, I think there’s a $3 move in the cards here as earnings approaches a week away on May 11. Goal is profit in upper $2’s.
Why I Took Profits Ahead Of My Target
Now, when it comes to trading momentum stocks, sometimes I will deviate from my rules.
Why?
Well, chart patterns change and I take into account the information.
For example, in SIEN, I noticed a triple top right around $2.80. As my saying goes with triple tops or bottoms, they usually aren’t.
You see, a double top or bottom is considered resistance or support in my mind. However, a triple top or bottom usually, in my opinion, isn’t. In other words, if that area is tested a third time, it’s usually a good sign it’s going to break.
In this case, a break of $2.80’s could cause momentum traders to pile in the stock, and it may have made a move to the $3 to low $3’s area.
Now it may not work but this is a probability game. In my opinion, each time it tests the resistance level, I believe there is potential for the stock to break out…
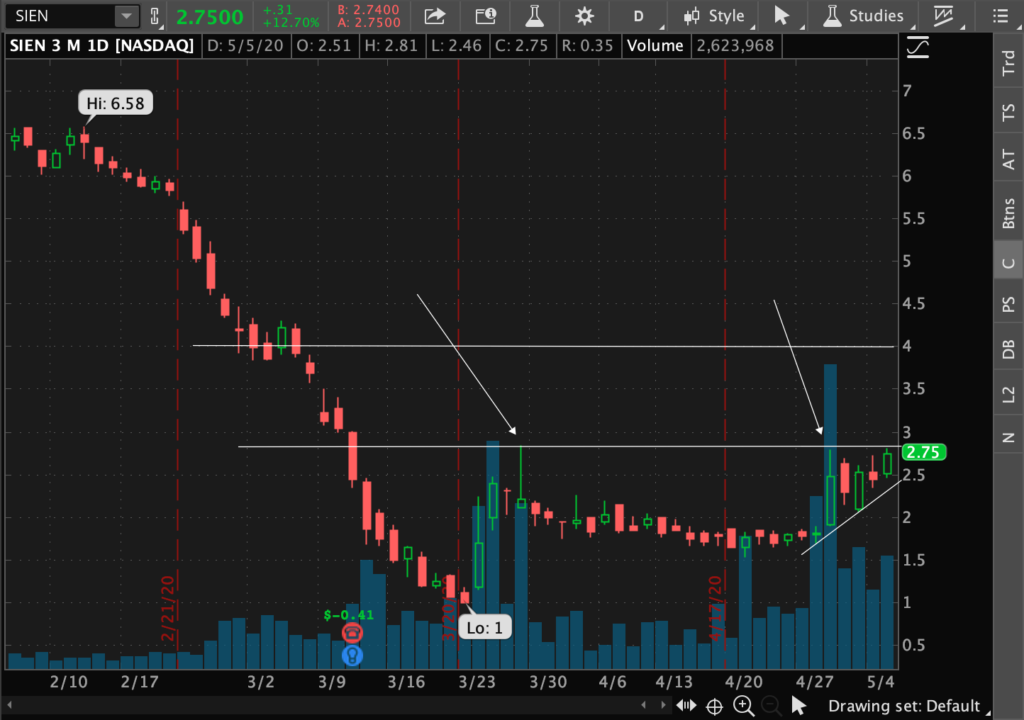
Source: thinkorswim
Now, with SIEN… it actually briefly got above that triple top… but it didn’t stay up there for long. Of course, my thesis broke after… and I decided to close out my position in the $2.70s for about $5K in profits.
When it comes to momentum trading, I think it’s important to be nimble and understand chart patterns. If you want to learn more about how I trade momentum stocks, then click here and attend my masterclass.
0 Comments