Good morning, I’m writing to you from Turks & Caicos while watching the sun rise over the ocean and listening to the waves crash. This is why I love stock trading, you can do it from anywhere.
So commodities tanked and stocks rose this week, with the drop in the price of West Texas Intermediate Crude (WTIC) leading the way to a commodities complex plunge. Bank and tech stocks outpaced industrial stocks, while commodities stocks were hammered.
At the close of trading Friday, the DJIA, S&P 500 and NASDAQ rose 0.32%, 0.63% and 0.88%, respectively. The NASDAQ closed at 6,100.76, a weekly all-time high, led by Apple Computer (AAPL) 3.70% rise.
The Russell 2000 Index of small-cap stocks didn’t follow its bigger-name brethren to more gains, falling 0.25% for the week.
And good news for the followers of Dow Theory (I, among them), the DJTA rose 1.01% and outperformed the DJIA this week. That’s an encouraging sign. I need to see the DJTA outperform the DJIA in the coming weeks to feel better about stocks during this present rally. But so far, so good.
In bank stocks, Deutsche Bank’s (DB) 7.08% rise typified investor confidence in the banking sector following news of Conglomerate HNA increasing its stake in the German bank to 9.92%. Fears of Deutsche Bank requiring help from the ECB abated substantially this week, providing additional interest in bidding the euro, which propelled this week by a full penny to close (1.099) above its 52-week moving average for the first time since October.
The weighted rise in the euro dropped the USD Index to 98.53 at the close of Friday’s trading on the Forex. The USD Index now rests on its 52-week moving average and approaches its regression outer bound (see chart, below).
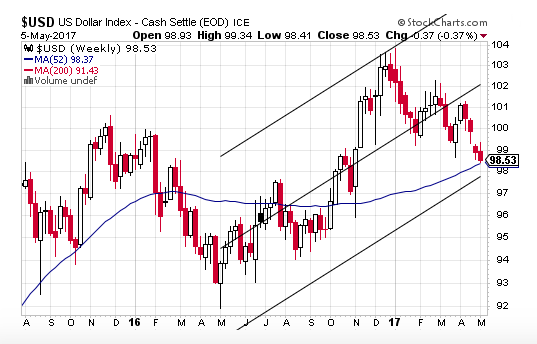
I don’t expect the euro to continue moving too much higher against the US dollar, but instead expect the USD Index to rebound at 97.75, if the index reaches that level. You see, the ECB is in a much darker place than the Fed is, and much about the euro’s rise of the past couple of weeks is easily attributable to an expected Macron win in the French presidential race. And that happened, so maybe we’ll get a bit of a boost to the euro, then the resumption of weakness during the second half the year.
Other than this impetus for a relief rally, there is nothing on the horizon that would necessarily translate to euro strength. Much of my strong-dollar thesis is predicated upon the relative weakness I see in the major competitor to the US dollar system, the euro, this year and for some years to come.
Another factor affecting money flows into US stocks is the yen’s weakness, which was revealed again this week with its 1.05% drop (88.71) against the US dollar. A weaker yen brings dollar to US stocks, as Japanese seek some yield. And it’s been three weeks in a row that the yen has lost ground against the dollar as it now trades significantly below its 52-week moving average.
Just as I pointed out the divergence between the VIX and SKEW in my last week’s report, that divergence rapidly closed this week, as the SKEW crashed 15.62 points to close the week at 131.36.
The VIX closed Friday at a very low reading of 10.57. So, it appears we’re back to a complacent market once again from the point of view of both short-term tactical and longer-term strategic traders.
There was nothing much going on in the debt market this week that would catch my attention. The US Treasury 10-year note yield rose to 2.36%, up seven basis points for the week. The yield curve (10-year minus two-year) settled at 104 basis points. I watch the yield curve for signs of capital moving into safety. A flattening of the curve suggests money is moving to safe ground, which then implies stocks may become vulnerable to a selloff.
But it was the action in the commodities markets this week that piqued my attention the most. The CRB Index dropped smartly by 2.09% during a 6.30% smash of WTIC.
At one point, WTIC had broken down through $44 at a panic pace, but then settled at $46.22 So, within three weeks, the oil price has cascaded 13.3%. Look for more stable prices this week. I noticed Friday’s plunge elicited a lot of buying below $45.
But the damage in the oil market has been done. And didn’t I continually warn of this day coming?
As early as March 20, I wrote:
I really think WTIC may reach $45, and possibly $40 by the end of the year. I see no reason for higher oil prices during record inventory builds at Cushing, Oklahoma and rising rig counts. These two leading statistic spell disaster for any chance of a bull market remaining in WTIC this year, unless, of course, trouble begins in the the most vulnerable counties of the oil industry, Iraq and Libya, of course.
So, now that oil has reached my $45 target—and a lot earlier than I anticipated (maybe not)—do I now see the oil price falling to $40 per barrel? Who knows? But, taking that gamble is now a 50/50 proposition, maybe, and I don’t like those odds.
For those of my readership who play oil stocks, at this point, watch how the bigger oil producers and services companies (XOM, SLB) trade before speculating on your favorite junior producer and explorer. We may be nearing the bottom in the oil price, but trying to ‘catch the falling knife’ is for suckers, of course.
And for those silver investors, my heart-felt sympathies go out to you this Monday morning. The precious metals market took a beating this week, led by silver’s $0.99 smash (-5.72%). Silver closed at $16.27 per ounce.
Gold took a hit as well, falling $41.40, to close at 1,226.90 per ounce. There may be more drops coming, but I think the longs in the silver market have already capitulated to the bullion cartel once again. And a slew of commercial shorts covered this week, so those waiting to buy silver at a good price may be staring at one right now. Apportion four or five trading units and begin buying on the dips, if that’s the commodity in which you want to be.
My price target of $1,325 for the dollar-gold price may not be reached by June 30. We reached a hair below $1,300 in mid-April in the dollar-gold price, but the extra 2% move needed to reach $1,325 was not there.
But the consolation is that my expectation of a widening in the gold/silver and gold/copper ratios worked very well, with both widening for more than an 80% return, respectively, for those spreading future contracts.
Unless you’re greedy, closing out these trades should swell your trading account nicely. A continuation of the widening is now much, much more risky.
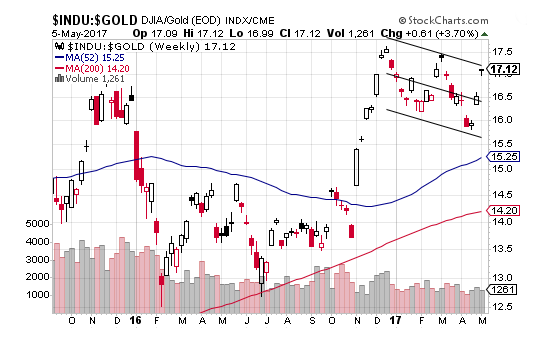
So, now what? Do I see any more macro trades? Well, yes. Watch for a closing of the DJIA/gold ratio in the coming weeks. We may be approaching a turning point in the ratio (see chart, below). If not, the divergence between stocks and gold may really become a once-in-a-year spread trade opportunity.
Therefore, for those junior mining enthusiasts among my readers, you may begin finding bargains during the remainder of this month and the month of June. Keep with the liquid shares and names with an excellent reputation, of course.
In the copper market this week, the price of the bellwether industrial metal drop 3.03% to close at $2.53 per pound. If you remember, I continually mentioned the copper price flirting with, but never breaking, its 200-week moving average since the post-US-election rally in the metal. Nine failures to break the 200-day moving average out of nine attempts are a sure sign of reluctance among the longs to break out. Along with the oil price, copper was itching for a selloff. The gold/copper ratio is trending upward, but the momentum is lost.
And did you catch this bit of news? It appears a lot of gains in US stocks during the first quarter came courtesy of the Swiss National Bank (SNB). Here and here are the article about the SNB purchases, and here’s the link to the 13F filed with the Securities Exchange Commission (SEC).
I knew the action in stocks at some key junctures was very suspicious. As I have stated, the NY Fed, of course, may be involved from time to time, but the SNB is involved, for sure. What a crazy situation. Here, one of the most strictly governed central banks of the world buys US stocks. What a bizarre world we now live in. Doesn’t this situation tell you that central banks are absolutely ‘all in’ to inflate financial asset prices? That’s why I follow Dow Theory. I never know for sure in which direction all tides are moving. So, in addition to retail traders propping up stock prices during the first quarter, central banks are directly buying stocks as well, while the cumbersome ‘smart’ money is selling.
Okay, let’s move on to my holdings. There will be a little boasting this week about the ANGI trade and my holdings of LQMT? Right?
My current portfolio: LQMT, CROX, LC, SIEN, GRPN and SC
This Week’s JBP Stock Ideas
Making up for the drop in GRPN of 13.87% this week, my huge 55% score on ANGI has put me into some ‘good green’ during the past two weeks.
Here’s a reminder of what I wrote about ANGI on February 27:
ANGI is one of those stocks I believe has been oversold due to the lack of guidance, which may suggest to some traders that the company is in serious trouble. Now trading at one-times revenue, I believe the stock suffers from another case of over-pessimism.
I also wouldn’t be surprised if Angie’s is sold. The company’s EV of $345 million is just barely more than its market capitalization of $326.27. Hmmm.
I’ve done pretty well with stocks whose management does a bad job of holding investors’ hands between quarterly results. There’s a when-in-doubt-bail-out attitude among amateur traders that has suited me just fine in many cases. I pick up stocks cheap.
My downside for ANGI is $5 per share, but my upside is $8.25, a 2.87:1 reward-to-risk ratio, with an announced buyout as my best-case scenario for ANGI.
Well, as you now know, Angie’s List was sold to HomeAdvisor. My $8.25 target was shattered to the benefit of me and my subscribers. Congratulations to all who were in on ANGI with me. The 55% gain within 10 weeks of holding the stock calculates to an 877% annual compounded rate of return.
And in my holdings of LQMT, the stock again spiked higher this week, this time by 9.91%. There was no news, but I can tell you that I’m pretty sure some shorts were covering this week. Approximately 200,000 shares had to cover in a market for LQMT that appears lopsided in favor of too many unwilling sellers. That is a very good sign! ‘Sticky’ buyers of a nano-cap stock can be very explosive to the upside. For those still not involved in this stock, check it out— ‘pronto’.
And SC, my short, fell another $0.34 this week, for a 2.67 gain for me. By late June, we could see a sub-$11 stock price. The channel selling points to that target and time frame.
JASON’S WATCH LIST
Fannie Mae (FNMA)
Here’s a bit of background on FNMA:
After the Trump victory in November, shares of Fannie Mae (FNMA) soared to as high as $5.00, from $1.65, an amazing move for only 16 days of trading. At that time, Trump was viewed as a pro-investor president, likely to nominate a treasury secretary who would take sides with investors.
Optimism and profit-taking held FNMA within a large trading range of $3.50 and $4.50, until February 21, the date the U.S. Court of Appeals ruled that investors have no standing to sue the Federal Housing Financing Agency (FHFA). On the news, the stock plunged to $2.71, from the opening price on February 21 of $4.18 per share.
So, what now?
Well, according to Height Securities analyst Edwin Groshans, further appeals are the only course left for investors, unless FNMA investors would like to wait as much as an estimated 11 years, according to Groshans, to recoup Fannie Mae’s value through earnings.
However, if suitors take their case against the FHFA, a successful ruling for the plaintiffs would realize “instant value,” according Groshans.
“It is our view that despite the string of court losses, legal action is the path that has the best chance of monetizing GSE preferred shareholder investments,” Groshans told Benzinga.
I agree with Groshians’ assessment. What else can investors do? The court system is the only way to go, as I see it.
I’ve add FNMA to my Watch List because of the risk/reward profile of the stock. Famed investor, Bill Ackman, of Pershing Square Capital Management estimates FNMA to be worth as much as $47 per share, if the plaintiffs prevail in the courts.
I have no problems with Ackman’s estimate. All I know is: FNMA is a clear double-digit stock price, when/if the value is released to investors and not retained by the FHFA.
I wrote in the April 24 edition of these reports about an interesting article about comments made about FNMA by famed bank analyst, Dick Bove. Here’s what I wrote last week:
No news about FNMA this week, but I found an interesting article about comments made by famed banking analyst Dick Bove, entitled, Rafferty Capital’s Bove Notes ‘Potential Game Changer’ for Fannie Mae (FNMA). It’s definitely worth the read if you want to jump aboard the FNMA drama.
Well, FNMA soared $0.46 to $2.97 per share, the week ending April 28, an 18.53% surge. Anticipation of the passage of H.R. 1694 out of the House Oversight and Government Reform Committee lifted the price of FNMA throughout that week.
H.R. 1694 was passed through committee just prior to the market close on April 27.
Under current law, plaintiffs in the lawsuit against Federal Housing Finance Agency (FHFA) ran into trouble to Fannie Mae’s exemption from the Freedom of Information Act (FOIA), apparently because, technically, Fannie Mae is not a federal agency.
How then are the plaintiffs able to prove intent in their lawsuit? H.R. 1694 provides for the inclusion of Fannie Mae and Freddie Mac under FOIA.
Well, the idea behind taking a long position into the passage of of H.R. 1694 is, now plaintiffs may uncover proof of a conspiracy by FHFA to withhold income derived from Fannie Mae to stockholders, knowing that lots of income would be expected following the conservatorship of Fannie Mae and Freddie Mac back in 2008.
Until next time…
Trade Wise and Green!
Jason Bond
0 Comments