Good morning.
Effective this week ALL Long-Term clients will receive my Day & Swing Trading newsletter FREE and my Long-Term picks will be in that newsletter portfolio moving forward, valued at $1,596 yearly. If you subscribe to both already, contact jordan@jasonbondpicks.com and he’ll adjust your account accordingly.
Aside from a new record high of the NASDAQ this week, the major averages fell, led by transportation and bank stocks. At the close, the major indexes settled as follows:
DJIA: 20,896; -110.33 (-0.53%)
S&P 500: 2,390.90; -8.39 (-0.35%)
NASDAQ: 6,121.23; +20.47 (+0.34%), led by Amazon (AMZN)
Russell 2000: 1,382.77; -14.23 (-1.02%)
DJTA: 9,0001.14; -188.83 (-2.05%), not good news this week for ‘Dow Theory’ fans
BKX: 91.46; -1.18 (-1.28%), led by Deutsche Bank (DB)
VIX 10.40 ( as low as 9.56); SKEW 129.65
After reaching a low of 9.56 Tuesday, the VIX settled Friday at 10.40. The SKEW dropped modestly to 129.65, and still trades below its upward-sloping trend line, established in December.
Did anyone see or read anything that would warrant a spike down in the VIX to 9.56 on Tuesday? Stocks were up, at the most, 28 measly points! It appears someone is selling lots of insurance for reasons of which no one seems to be aware. Is volatility now illegal, yet no one got the memo?
US Dollar/Yen 113.327 (-0.54%); Euro/US Dollar 109.26 (-0.65%)
Stocks were somewhat buoyant from a weaker yen and euro this week. And if we look at Tuesday’s strange CBOE VIX move to a ‘9 handle’, the yen was concurrently into a sharp decline of as much as 1.0%. Well, that’s interesting. Isn’t it? Is Kuroda directly, or indirectly, playing with hedging vehicles? I’m half kidding here, but someone’s selling lots of insurance.
DoubleLine’s Jeff Gundlach told Reuters on the day following the 24-year low in the VIX on Tuesday, “I think the VIX is insanely low. Anytime the VIX is below 10, if you could actually buy it, you should.” But of course, what? “But people can’t buy the VIX. A regular Joe can’t go long the VIX.”
“You should” buy the VIX. No kidding!
US 10-year Treasury: 2.33%; US 10-year minus US two-year (yield curve): 104 basis points; US 10-year minus Japanese 10-year: 228 bps; US 10-year minus German bunds: 194 bps
For now, nothing to see here in sovereign paper. As long as the spreads between the Japanese and German 10-year notes, respectively, and the US 10-year note are close to 200 basis points, everything is okay. Let’s see if the spread narrows some more between the Treasury and bunds. Only then, will I raise my eyebrows some.
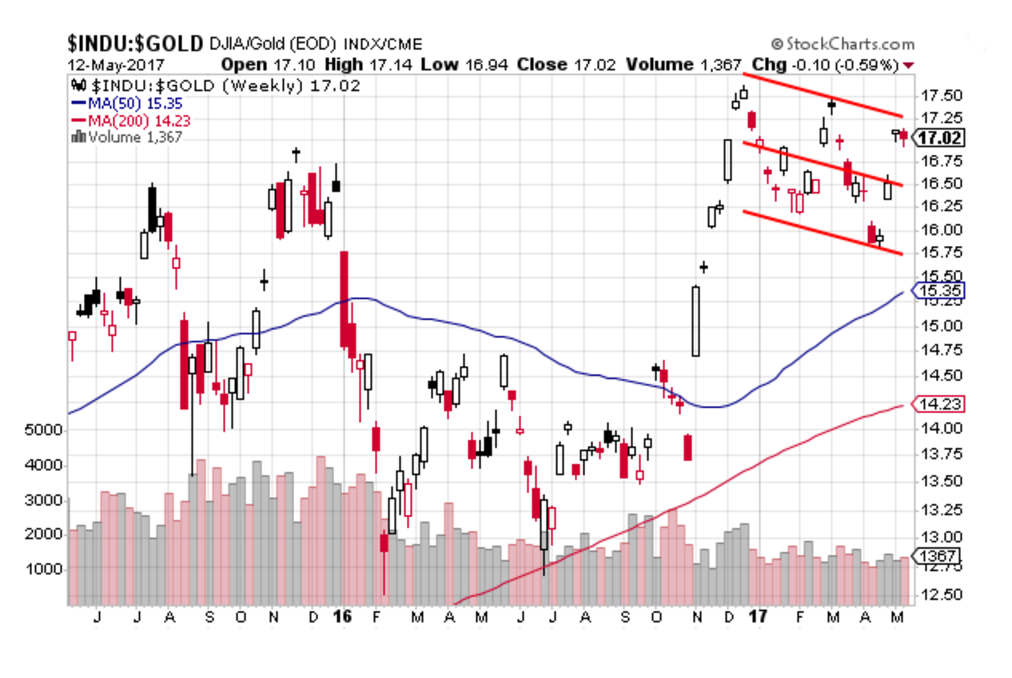
Gold: $1,227.70, +$0.80 (+0.07%); Silver: $16.40, +0.13 (+0.79%)
GDX: 22.72, +1.17 (+5.43%); GDXJ: 32.54, +2.27 (+7.50%); SIL: 35.39, +1.95 (+5.83%)
The big winners this week were the precious metals stocks. A massive gain of 7.50% to the gold junior mining ETF (GDXJ) stood out as the big trade this week.
Gold stocks typically lead the metal prices higher and lower. And right now, the GDX trades above its 200-week MA, while gold bullion trades below its 200-week MA. Although the dollar-gold price attempted to rise through its 200-week MA last week, on Monday, the move was thwarted and continued to trade under its 200-week MA during the remainder of the week.
Watch to see whether gold stocks retreat, or gold bullion shoots higher this week. If we look at the DJIA:Gold ratio, we appear to be trading at a critical juncture between both asset classes. I suggested last week that the ratio may narrow because I think gold appears to be catching bids at these lower levels, while the DJIA appears sluggish at its lofty levels.
But, if the DJIA:Gold ratio does break higher—through the trendline depicted in the chart, below—‘something’ major is coming down the pike to warrant a move into financial assets and out of insurance against central bank profligacy. Maybe Syria and North Korea will become Washington’s pals, and central banks make a joint new conference to announce a coordinated global tightening scheme. Sure. Of course, I’m kidding.
In fact, I’m betting the DJIA:Gold ratio narrows from here. The ratio has strayed a lot from its week MAs, so let’s see what happens.
Also watch the silver market, and the SIL. After the big 5.83% move higher to the SIL this week, the silver stocks may be signaling the coast is clear for the next move up in the dollar-silver price. After all, the commercial ‘shorts’ in the silver market have closed out many of their contracts, which is a good sign, too, especially after three brutal weeks of silver price declines, totaling a 14% retracement.
Interesting enough, the Gold:Silver ratio peaked at 76.47:1 this week, before settling at 74.85:1. And guess on which day this week the ratio reached the nosebleed high of 76.47:1? Yup, on Tuesday, the same day the VIX reached a 24-year low. Hmm.
Gundlach could be wrong. Maybe the “regular Joe” can’t buy the VIX at 9.56, but he can surely buy into a rebound in fear in another way. Buy silver.
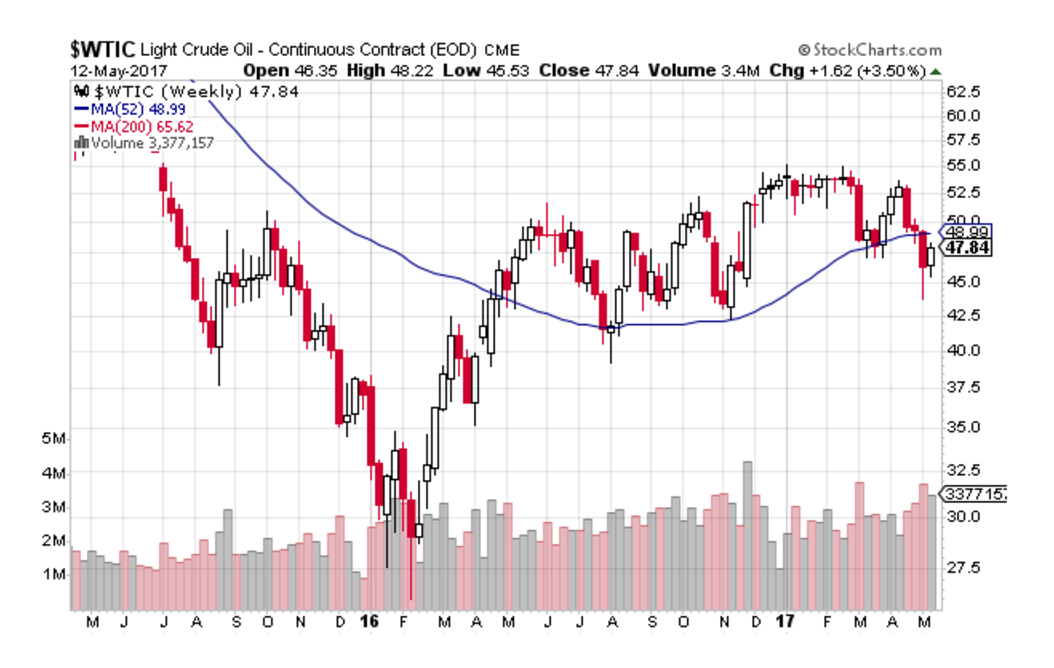
WTIC: $47.84, +$1.62 (+3.50%); XOM: $82.55, +$1.30 (+1.60%)
Okay, let’s talk oil. West Texas Intermediate Crude (WTIC) continues to bounce and rally off the $43.76 low of May 5. Since the low, WTIC has rebounded 9.32%, to close the week at $47.84.
As many of you know from my past reports, I’ve been expecting lower oil prices since February. We got a big move lower in the first week of March, but my target of $45 had not been met at that time. Well, now that $45 was sliced like a hot knife through butter on May 5, this rebound to the price of WTIC doesn’t surprise me. A move to the $49 handle (52-week MA at $48.99) should be rejected. I think WTIC will again retest and move lower to $45.
I like to use Exxon Mobile (XOM) as my proxy for ‘smart money’ in the oil market. As some analysts had said that oil is going to $60, the smart money playing XOM didn’t think so. Well, the XOM traders turned out to be correct. Instead of $60 oil, we got $43 oil. And how many times does XOM have to reject its 200-week MA before we see a breakdown in the stock?
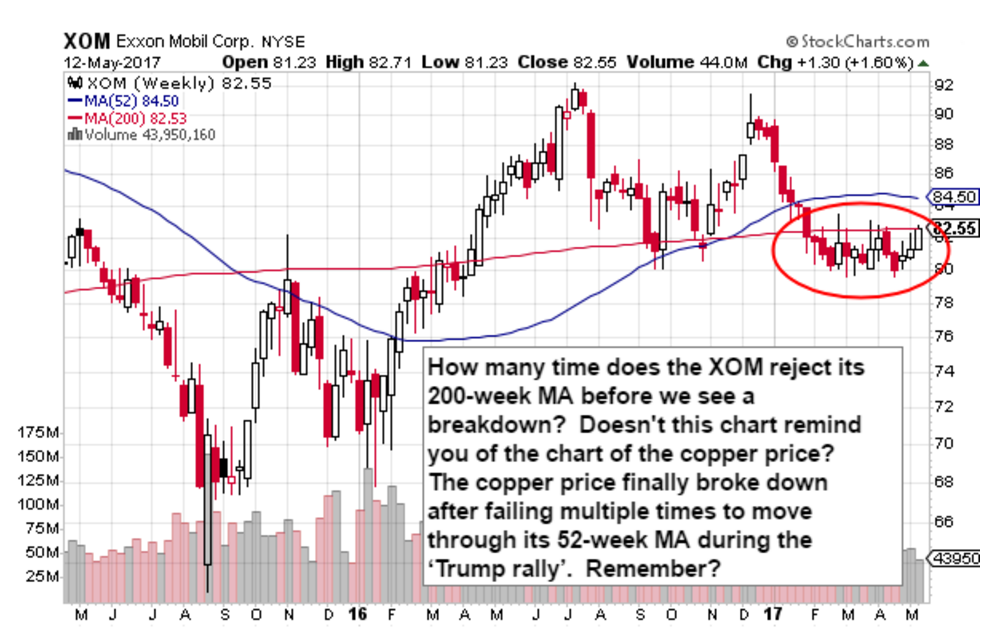
Doesn’t this chart of XOM, above, remind you of the chart of the copper price of the past several months? Well, as we know (and reported here, many times) the copper price finally broke down after failing multiple times to move through its 52-week MA during the ‘Trump rally’. Remember?
I anticipate the oil price and oil stocks to remain ‘asked’ in the coming weeks—all else remaining equal on the geopolitical front, of course.
Copper: $2.524, -0.005 (-0.18%); Freeport-McMoRan (FCX): $11.51, -$0.29 (-2.46%); CRB: 181.69, +3.77 (+2.12%)
And speaking of copper, Dr. Copper closed the week nearly unchanged. In the case of the copper price, until the folks who trade big in the market for Freeport-McMoRan (FCX) take FCX above its 52-week MA, I’m not making any bets in the copper mining shares anytime soon.
And as a final thought, I’ll be watching the US dollar/yen for further weakness. I won’t be surprised if the yen reaches 117.65 (or 85.00 on StockCharts.com; symbol $XJY) in the coming weeks. Well, if I’m right, that’s good for US stocks, as yen weakness is generally supportive of stocks.
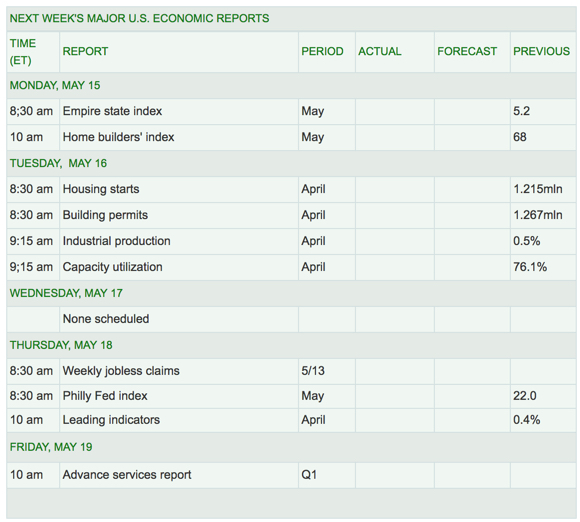
Earnings season is almost over, with approximately 4% of companies not yet reported. So, then, what will drive stock prices this week? We have the following calendar, below, of macro data coming out this coming week. From a look at the calendar, Thursday morning is the big day and time on the data front. Jobless claims, Philadelphia Fed and the latest reading of the Leading Economic Indicator (LEI) are due.
The Atlanta Fed has been leading Fed data towards revisions down to GDP. Let’s see what what the Philadelphia Fed has in store for us on Thursday.
And the most important statistic on Thursday, the Conference Board LEI, is one I watch closely. There are nuggets of statistics about labor, housing, manufacturing, services and consumer sentiment in the LEI.
Okay, let’s move on to my holdings.
My current portfolio: LQMT, CROX, LC, SIEN, GRPN and SCOkay, let’s move on to my holdings.
This Week’s JBP Stock Ideas
There were no trades this week. But did you see CROX spike Wednesday?
I’ve been in CROX since January, and on Wednesday the company released Q1 earnings, which were better than expected.
I rode this one down from my $7.07 entry, and will gladly use this bump to look for profit in the coming days between $7.50 and $9, depending on how it trades from here. For the week, CROX rose $0.90 (15.15%), to close at $6.84 per share.
Net income for the quarter to March 31 rose to $7.16 million, or 8 cents a share, from $6.4 million, or 7 cents a share, in the same period a year ago. Excluding non-recurring items, adjusted net income was $9.3 million. The FactSet consensus was for earnings per share of 3 cents.
Revenue fell to $267.9 million from $279.1 million, but was above the FactSet consensus of $258.1 million. The company closed a net 16 stores during the quarter, and signed deals to transfer 24 company operated stores to distributors during the second quarter.
Looking ahead, the company expects second-quarter revenue of $305 million to $315 million, below the FactSet consensus of $323 million, and cut its 2017 revenue outlook to be down in the low single-digit percentage range from previous guidance of flat.
The stock had dropped 9.6% year to date through Tuesday and above $7 is a key pivot that will likely take the stock to the $8 and $9 range, in the short term, if that previous resistance acts as support.
I’ll alert you when I exit. I just want to give you the heads up on my target here, now that we’re heading in the right direction.
JASON’S WATCH LIST
Fannie Mae (FNMA)
I wrote in the April 24 edition of these reports about an interesting article about comments made about FNMA by famed bank analyst, Dick Bove. Here’s what I wrote last week:
No news about FNMA this week, but I found an interesting article about comments made by famed banking analyst Dick Bove, entitled, Rafferty Capital’s Bove Notes ‘Potential Game Changer’ for Fannie Mae (FNMA). It’s definitely worth the read if you want to jump aboard the FNMA drama.
Well, FNMA soared $0.46 to close the week at $2.97 per share, an 18.53% surge. Anticipation of the passage of H.R. 1694 out of the House Oversight and Government Reform Committee lifted the price of FNMA throughout the week.
H.R. 1694 was passed through committee just prior to the market close on Thursday.
Under current law, plaintiffs in the lawsuit against Federal Housing Finance Agency (FHFA) ran into trouble to Fannie Mae’s exemption from the Freedom of Information Act (FOIA), apparently because, technically, Fannie Mae is not a federal agency.
How then are the plaintiffs able to prove intent in their lawsuit? H.R. 1694 provides for the inclusion of Fannie Mae and Freddie Mac under FOIA.
Well, the idea behind taking a long position into the passage of of H.R. 1694 is, now plaintiffs may uncover proof of a conspiracy by FHFA to withhold income derived from Fannie Mae to stockholders, knowing that lots of income would be expected following the conservatorship of Fannie Mae and Freddie Mac back in 2008.
My subscribers who acted on my Watch List narrative on FNMA are doing quite well.
Here’s a bit of background on FNMA:
After the Trump victory in November, shares of Fannie Mae (FNMA) soared to as high as $5.00, from $1.65, an amazing move for only 16 days of trading. At that time, Trump was viewed as a pro-investor president, likely to nominate a treasury secretary who would take sides with investors.
Optimism and profit-taking held FNMA within a large trading range of $3.50 and $4.50, until February 21, the date the U.S. Court of Appeals ruled that investors have no standing to sue the Federal Housing Financing Agency (FHFA). On the news, the stock plunged to $2.71, from the opening price on February 21 of $4.18 per share.
So, what now?
Well, according to Height Securities analyst Edwin Groshans, further appeals are the only course left for investors, unless FNMA investors would like to wait as much as an estimated 11 years, according to Groshans, to recoup Fannie Mae’s value through earnings.
However, if suitors take their case against the FHFA, a successful ruling for the plaintiffs would realize “instant value,” according Groshans.
“It is our view that despite the string of court losses, legal action is the path that has the best chance of monetizing GSE preferred shareholder investments,” Groshans told Benzinga.
I agree with Groshians’ assessment. What else can investors do? The court system is the only way to go, as I see it.
I’ve add FNMA to my Watch List because of the risk/reward profile of the stock. Famed investor, Bill Ackman, of Pershing Square Capital Management estimates FNMA to be worth as much as $47 per share, if the plaintiffs prevail in the courts.
I have no problems with Ackman’s estimate. All I know is: FNMA is a clear double-digit stock price, when/if the value is released to investors and not retained by the FHFA.
I did end up grabbing FNMA Friday in the swing trade portfolio looking for a near term bounce to $3, but am waiting for a lower entry on any long term position.
Until next time…
Trade Wise and Green!
Jason Bond
0 Comments