Good morning,
So we finally have what appears to be a breakout in stocks. Global money poured back into U.S. stocks and U.S. dollar following Friday’s jobs report. The S&P 500 and NASDAQ closed at 2,182.87 (up 0.43%) and 5,221.12 (up 1.14%), respectively, and at record closes this week, as the NASDAQ impressively caught up to the DJIA and S&P 500 with a six-straight weeks of higher closes. The odd man out this week was the DJIA, which closed at 18,543.53 (up 0.60%), or within 27 points of its record close.
Curiously, however, digging into the details of the Bureau of Labor Statistics (BLS) employment headline number of 255,000 jobs added in July revealed a report laced with a large seasonal adjustment. Without the season adjustment addition, 85,000 jobs were created in July, with most of these jobs categorized as part-time or low-paying service jobs, such as waiters and bartenders.
For those readers not acquainted with the significance of the BLS jobs report, I can tell you that, in the old days, the report aided analysts to assess future demand for housing, home furnishings, automobiles and durable goods, such as air conditioner units, washing machines, motorbikes, et cetera. The airline industry would assume demand for trips to Europe or domestic destinations in the U.S. would rise as more workers found full-time, household-forming jobs.
Folks, part-time bartenders don’t suddenly qualify for a 30-year mortgage or make plans to visit Paris on holiday. The “new normal” of the BLS report is that it has become a complete fictitious, Soviet-like propaganda apparatus of Washington’s.
And to really throw a monkey wrench into the all-is-well camp came on Thursday, the day before the jobs report, when the U.S. Commerce Department reported a 5.6% y-o-y drop in factory orders, the worst report since September 2015 and the 20th straight monthly drop in the index, a U.S. record series of declines!
Oh, and don’t forget the Commerce Department’s downward revision of Q2 U.S. Gross Domestic Product (GDP) to 1.2%, reported in the prior week. So, suddenly the jobs market is soaring?
Zerohedge writes about the July jobs report:
We leave it up to readers to decide just why the government may want to represent what would otherwise have been a far weaker than expected report, into a blowout number, one which merely adds to the economic “recovery” narrative, which incidentally will come in very useful to Hillary’s presidential campaign.
In short, the July jobs report doesn’t impress me one bit, especially after crosschecking BLS statistics with Commerce Department’s data.
However, central banks and their comrade-in-arms in Washington won’t let us down with shocking data or sudden money supply tightening by the Fed during the final days of this campaign year. I can nearly assure you of that. So, I’ll be assessing whether, or not, to add to my positions more intently if I see some follow-through to Friday’s favorable action this week. Each week needs to be evaluated upon its unique particularity, so that’s what I’ll do. If Washington appears to embarking on an all-out pump of U.S. stocks, I’ll respond accordingly.
But I still have my good eye following the VIX and its unlikely statistical reading of 11.39, which is now a lower reading than last week’s bizarre reading of 11.87. Remember last week when I wrote I’m “spooked” by the VIX’s low reading? Well, someone actually performed some inferential statistics this week to validate my gut’s response to the VIX.
JP Morgan’s head quant trader, Marko Kolanovic, notes in his letter to clients that, since the Brexit vote of June 23, market pricing data calculated to “a once in 50,000 year” occurrence, on top of “a once in 50,000 year” market action for the EuroStoxx 50 index. See zerohedge article.
I had no idea of how unlikely the data works out, statistically, all I know is that I’ve been at this game a good number of years (and more, in study), and know a rat when I see one. I remain spooked.
And at the risk of “beating a dead horse,” my suspicions of increased central bank direct intervention in stocks reveals again my gut to be in fine working order. Again, twice from zerohedge:
In the second quarter, the Swiss National Bank added $7.3 billion to its US equity portfolio, and according to its just filed 13-F, is now long a record $61.8 billion in US stocks, up from $54.5 billion a month ago. In fact, rising from $41.3 billion in total US stock holdings as of December 2015, this means that the Swiss central bank increased its total US holdings by a record 50% in the first half of 2016. Source: zerohedge.com.
And this:
Central banks are taking us to a place with no precedent, which is becoming more dangerous by the day: not a single “expert” dares to refute any more that the only reason the S&P500 is at record high is because global central bank QE has hit a record $180 billion per month.
Source: zerohedge.com, Deutsche Bank Global Markets Research.
So, there you have it. After reviewing the graph, above, we now know the SNB and ECB have been accelerating asset purchases, in addition to the BOJ’s steady pace as Governor of the BOJ Haruhiko Kuroda promised.
“As Bank of America’s Barnaby Martin calculates, following the BOE relaunch of QE, ‘around 45%’ of the global fixed income market is now ‘compromised’ by central bank buying,’” zerohedge writes.
I say, lower bond yields drive dividend-yielding equities higher as a welcome side-effect of all those purchases of fixed income securities.
Now, for a the mailbag. Kyle K. from Morristown, NJ writes:
Q: Jason, I’ve been a subscriber as far back as your first issue. My girlfriend is a stockbroker for Morgan Stanley. She wants me to ask you a question about your sources. Do you have inside sources?
A: I take that as a compliment, I guess. If I’m correct a lot, I must have inside sources, is the implication of your question, as I take it, Kyle.
Well, I spend most of my time reading everything I can get my hands on to supplement my experience with a developed “feel” of markets.
There are some very strong minds and well-connected individuals (zerohedge.com, as one example) who receive notes and reports from competent and reliable sources of proprietary data and analysis. Many of these analyses are very well done and aid me with my trading decisions. Sources are nice, but hard work pays the bills.
In the end, my job is to “read the instruments”, per se, and time my trades to coincide with money flows in addition to my analysis of individual stocks. Make sense? Good question, Kyle.
Okay, let’s get back to work with my two long positions and an update to my watch list.
This Week’s JBP Stock Ideas
Fannie Mae (FNMA)
I’m long 10,000 shares of Fannie Mae (FNMA) at $2.03. FNMA dropped this week by 7 cents, but the stock still trades at/above its 52-week moving average. Volume was very light this week, so the trade has been uneventful since I bought my shares in July. And as a result, RSI and MACD are uninspiring as well, signaling nothing significant to technical traders (see chart, below). I suspect when FNMA does move, it moves hard.
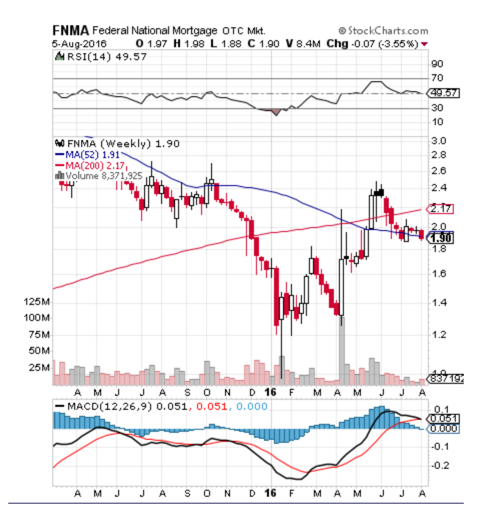
The chart pattern of FNMA, however, shows a nice bullish pattern of higher highs and higher lows. As far as holding period, I’ve already stated that FNMA is a long-term hold on a bet of a favorable outcome to a class action suit waged at the U.S. Court of Appeals for District of Columbia Circuit.
As I’ve outlined in previous editions of the LT Report, many investors are holding FNMA shares for the duration of the legal battle over whether the FHFA had the legal authority to deny shareholders dividend payments issued by Fannie Mae during the GSE conservatorship.
Some analysts and hedge fund managers believe a favorable outcome to the case may be worth a 10-bagger move in the share price of FNMA. I am among these optimists who believe the stock trades at, literally, 10% of intrinsic value.
Anyone who wants to get into the down-and-dirty details of the case, there is a fantastic article (a thorough, but very arcane read) posted on Seeking Alpha (August 4) about the issues involved at the U.S. Court of Appeals at the D.C. District.
Glu Mobile (GLUU)
On Friday, I issued an Alert to my trade in GLUU. I bought 5,000 at $2.22 with the intent of holding for some months, and possibly buying another 5,000 shares above $2.00 pr share. The stock closed the week at $2.23 on higher than average volume. Apparently, there were lots of traders who were more than willing to pick up shares at near the stock’s closing low of $2.18 in January.
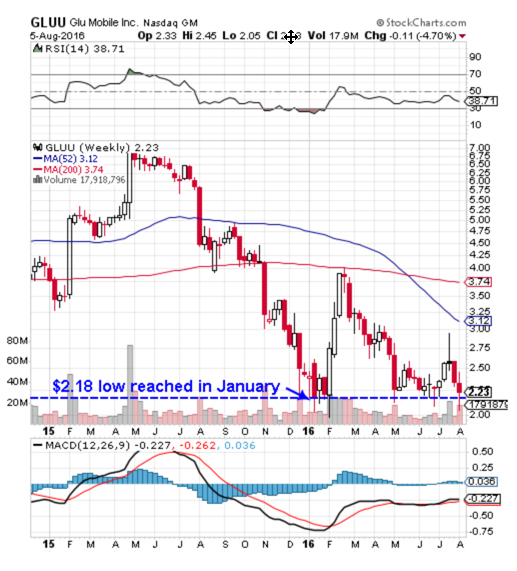
The GLUU trade this week was volatile, with a price ranging of $2.45 and $2.05 (19.5%). Capitulation by the longs kicked-off on Wednesday following Tuesday’s earning report. GLUU did fine on the earnings per share as I expected, so the relief of lower prices on Wednesday gave me breathing room and a window into Thursday’s action, which resulted in a higher low and higher high from Wednesday’s trade, a very good sign and impetus for me to enter the trade early Friday.
As I’ve stated for the past three weeks, GLUU’s relatively low valuation when compared with the valuations of Zynga (ZNGA) and Electronic Arts Inc. (EA) attracted me to the stock. In a direct comparison, GLUU’s Price-to-Sales (P/S) of 1.31 is dwarfed by ZNGA’s P/S of 3.02 and EA’s P/S of 5.38. And half of GLUU’s Book Value is made up of $160 million of cash!
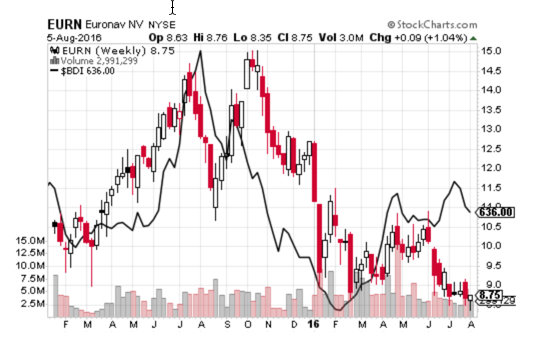
Euronav NV (EURN)
EURN closed up $0.09 this week at $8.75, bouncing smartly from the low of $8.35 earlier in the week. Did Euronav buyback more shares this week? See my analysis of the Euronav’s buyback program in the August 1 LT Report.
We’ll find out soon enough if the company was actively buying its own shares when the stock dropped below $8.50. I’ll be watching for news releases.
I’ve included a chart (below) of EURN compared with the Baltic Dry Index (BDI). From the chart, below, you’ll see a high correlation between EURN and the BDI, up until June, when EURN continued to slide while the BDI rose.
The latest news on VLCC (very large crude carrier) rates indicated a plunge to $16,482 per day on July 29 from $23,873 per day on July 22. Rates haven’t dropped below $20,000 per day since October 2014. Oversupply of VLCCs in late July was attributed to the plunge.
Euronav (EURN) primarily operate VLCCs, so the news was especially pertinent to the company and my ongoing analysis of the stock.
Time charter rates for VLCCs dropped as well, but not nearly as much as spot daily rates have. A one-year time charter for a VLCC fell to $33,000 on July 29 from $35,000 in the previous week.
A lot of EURN’s trading in June and July reflected the expectation of lower VLCC rates throughout the early summer months, so this news, though not good, had been priced in along with the company’s earning report in late July.
Let’s see if Euronav continues to support the stock in August, as I expect August rates to show no improvement from July’s. I’ll be extra cautious on this trade; I’m not interested in “catching a falling knife” at this time in the EURN trade. I’ll keep you posted.
Trade Green!
Jason Bond
when are the day trade videos going to be available?
They are included in the Pro DVD. I will be doing more though.