Good morning,
After four weeks of U.S. dollar strength, this week’s strong retreat of the U.S. currency against the Japanese yen and euro caused headwinds for stocks. At the close of trading Friday, the DJIA and SP 500 shed 0.75% and 0.07%, respectively. Aside from the NASDAQ’s 1.22% move higher on the back of a big move higher in the share price of Apple Computer (AAPL), who reported earnings earlier in the week, this week was a ‘risk-off’ trade for U.S. stocks.
Expectations of another Kuroda surprise leading up to the announcement scheduled by the head of the Bank of Japan (BOJ) had lifted U.S. stocks earlier in the week from capital flight out of the yen and into U.S. assets; but Kuroda disappointed traders Friday with language suggesting a rethink of the BOJ’s aggressive pace of ongoing asset purchases.
Following the announcement, the yen soared 3.12% against the U.S. dollar (3.95% for the week), taking the fuel of the yen carry trade away from the U.S. and back to Japan. The euro spiked, as well, in sympathy with the yen, rising 0.86% Friday and 1.80% for the week.
More bad news for stocks came Friday after the U.S. Commerce Department reported a 1.2% increase to Q2 GDP (expectation 2.6%) and a downward revision for Q1 to 0.8% (expectation 1.1%). These GDP reports didn’t surprise me, as I’ve noticed a strong bias toward downward revisions to GDP during softening economic cycles.
As my readers know, I’ve been very cautious since the Brexit vote of June 23, and have had expectations of surprises that would knock U.S. stocks following the capital rush out of the political turmoil in the European Union and into the relative safe haven of U.S. markets. Well, I was fortunately correct and maintain my cautious stance as we move into August, a historically very low-volume month for stocks.
The gold market expressed a more truthful sentiment about U.S. dollar more clearly this week, as the yellow metal and principal competitor to the dollar rose as much as $23 on Friday (up $34.50, or 2.61%, for the week) following the BOJ and U.S. Commerce Department news events. In short, dollar-denominated traders took substantial losses this week in purchasing power priced in euros and, especially, priced in yen and gold. Priced in gold, yen and euros, the DJIA slid significantly by 3.27%, 4.52% and 2.51%, respectively.
And against the turbulent backdrop to this week’s action in currencies and stocks was the move lower in the VIX. Friday’s close of 11.87 defied all conventional wisdom while the U.S. dollar crashed 2.08% on the USD Index for the week, settling below its 50-day, 200-day and 52-week moving averages in one full sweep on Friday.
I’m watching the dollar and VIX very closely this coming week. With the knowledge of the VIX’s five-year average of 19.5 in the back of my mind, a 11.87 reading at this time boggles my mind. From where are traders getting so much complacency?
Either some backstage actors are buying massive amounts of call options to support stocks or, big money is front-running a Fed reversal of its hawkish narrative and actually begin to prepare markets for a Fed easing. Of course, as I stated in my last edition of the LT Report, Dow stocks are still yielding dividends of at least 100 basis points more than the U.S. 10-year Treasury note. And stuffing a billion dollars somewhere in a hurry can be absorbed by blue chips.
I suspect the U.S. dollar has reached an interim peak and a correction (or sideways trading, at best) in stocks may be nearing. The landscape I see ‘spooks’ me, to be frank.
To add a little color to my spooked disposition, let’s take a look what happened this week in the oil and bonds markets and the trade in Deutsche Bank (DB). The price of West Texas Intermediate Crude (WTIC) led declines in commodities prices again this week, with another 5.86% drop in WTIC to add to last week’s 4.52% slide. On Friday, WTIC closed at $41.60 per barrel, settling below its 52-week moving average.
Now that we know GDP growth didn’t even cover U.S. population growth in Q1 or Q2, I’m watching crude more closely for signs of a market realization that a global recession is at hand. I assure you the Fed had already been tipped off about the contents of the Commerce Department report on GDP and may have intervened in the stock market Friday to continue the illusion of prosperity.
And a strong bid for bonds against a backdrop of U.S. dollar weakness indicates a further dichotomy between stocks and the U.S. Treasury market, as the 10-year U.S. Treasury yield dropped another hefty 11 basis points this week to settle at a yield of 1.46%, while the 10-year/two-year Treasury spread narrowed another seven basis points in addition to last week’s three-basis points drop, to close at 79 basis points.
And Deutsche Bank (DB) was pounded again this week, sliding 6.34%, after the largest and most financially vulnerable Western commercial bank reported terrible earnings on Wednesday. DB now trades only $0.84 north of its all-time low of $12.60.
As a recap of my thoughts, I see more and more smart money bailing out of the Fed’s sanguine narrative each day. I think Friday’s news events were pivotal to the thinking of whether or not the Fed will reverse and cut rates. As I’ve said for many weeks, the economic data show a rate rise may crash markets. It then becomes a question of whether the Fed will remain on hold or cut rates. At some point, the Fed will have to cut rates or dream up some new scheme to increase its balance sheet.
Who knows? Maybe the Fed won’t wait until after the election to cut rates. I wouldn’t put it past this White House, or any White House for that matter, to use the Fed as a political tool during an election year. Democrats really fear a Trump presidency. Expect the unexpected.
Finally, allow me to publicly answer an email sent by Dustin B. from Austin, Texas, who responded with a follow-up question to last week’s mailbag question regarding my light trading activity:
Q: Jason, what are you looking for as a sign to get us back to trading?
A: A much higher VIX reading, for one, and an event that shakes up the stalemate in the major indexes, for a second. Look closely at the chart of the DJIA. Does it look like traders are convinced of anything? A top-heavy chart and an ultra-low VIX downright gives me the creeps.
And trading during the most controversial political national conventions since 1968 adds additional risks to my trades. Now that the presidential campaign season kicks off in earnest this week, let’s see what breaks this market one way or the other.
And think about this for a moment: if volatility in stocks has been nearly nonexistent for two straight weeks, doesn’t that indicate to professional traders and our algo friends at Citadel that everyone has been sitting on their hands waiting for a break? It sure does to me! Hang in there. Action following a lull is usually worth the wait.
This Week’s JBP Stock Ideas
Fannie Mae (FNMA)
I’m still long 10,000 shares of Fannie Mae at $2.03. This week’s trade above the stock’s 52-week moving average at $1.92 is reassuring. And like the volume in the major averages, FNMA’s volume has dropped to a trickle. Traders of FNMA are in a wait-and-see mode, as I am.
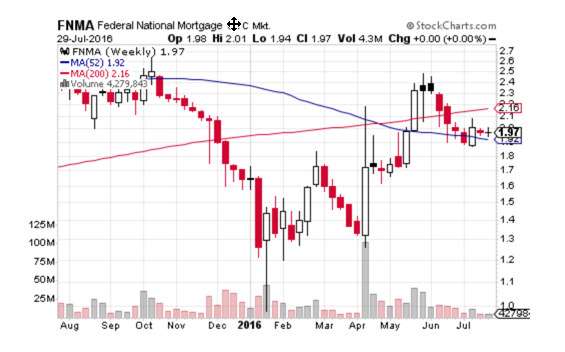
The chart of FNMA shows a nice stair-stepping bullish pattern of higher highs and higher lows. I’m betting on another leg higher, but, as I’ve stated, I’m in FNMA for a longer haul than than the next week or month.
Reprint from 07/25/2016 LT Report:
FNMA is a stock I’m planning to own for months or years due to the unusual circumstances of the trade. As I’ve outlined in previous editions of the LT Report, investors await a ruling by the U.S. Court of Appeals regarding legal issues stemming from actions taken by FHFA to deny shareholders dividend payments issued by Fannie Mae.
If I’m correct about the FNMA trade, I may stand to make a 10-bagger. A couple of hedge fund managers, include Bill Ackman of Pershing Square Capital Management, who own the stock with the have already suggested even higher capital returns. Ackman values FNMA between $40 and $50. Wow.
Glu Mobile (GLUU)
GLUU was hammered down this week by 22 cents, or 8.59%, which is a good thing, because I like the stock and don’t ever want to chase a stock when I’m ready to buy.
The mobile game space attracts a lot of risk capital, including GLUU, a favorite stock of mine to trade for its small market cap, occasional surprise hits and volatility.
Today, I’m focus upon GLUU’s relatively very low valuation when compared with the valuations of Zynga (ZNGA) and Electronic Arts Inc. (EA). In a direct comparison, GLUU’s Price-to-Sales (P/S) of 1.33 is dwarfed ZNGA’s P/S of 3.16 and EA’s P/S of 5.33. GLUU trades right at Book Value, with approximately half of that value held in cash: $160 million.
Earnings are expected on Tuesday. The consensus estimate range for revenue is $46 million and $49 million. EBITDA range is a loss of $5.5 million and $7.0 million, with an expected loss per share range of 5 cents and 6 cents.
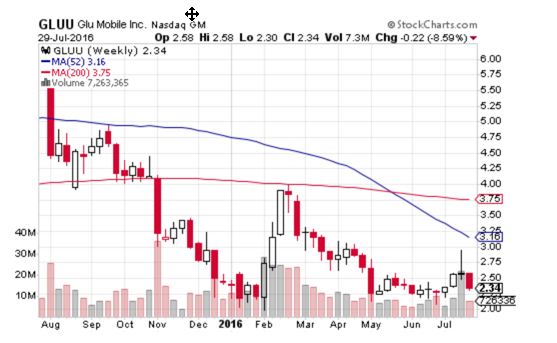
GLUU has rarely surprised, but when it does, the stock soars. Notice the double bottom at $2.10, below. I’ll be watching that support when the overall market breaks from the past two weeks of humdrum volatility.
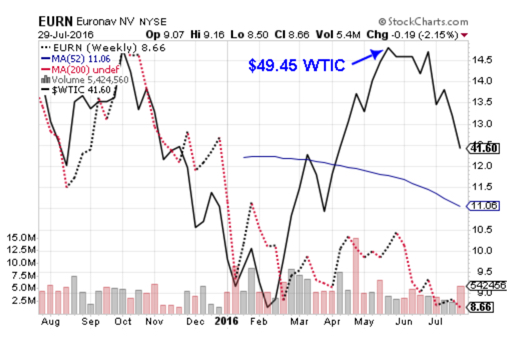
Euronav NV (EURN)
EURN closed down $0.19 this week to trade at $8.66, near the level I expect to hold from further deterioration to the price of the stock.
As I stated in my email Alert on Jul. 15, there are multiple catalysts that may elicit a strong bid for EURN, including a bounce higher in the price of crude oil (see chart, below). I expect central banks and Saudi Arabia to somehow keep oil prices elevated (in the case of the NY Fed’s Exchange Stability Fund or by some other means) due to the $1.0 trillion overhang of subprime debt issued to small fracking companies throughout the U.S. and Canada.
And as an additional incentive for me to look hard at EURN is management’s cooperation via a stock buyback program announced on July 1. See my source document here.
The news release states:
ANTWERP, Belgium, 1 July 2016 – Euronav NV (NYSE: EURN & Euronext: EURN) (“Euronav” or the “Company”) today announces that the Company has purchased 192,415 of its own shares on Euronext Brussels for an aggregate price of EUR 1,528,211.
Date Quantity Avg. price Low price High price Total price
24 June 2016 75,270 7.8714 EUR 7.714 EUR 8.000 EUR 592,480.28 EUR
27 June 2016 117,145 7.9878 EUR 7.960 EUR 8.000 EUR 935,730.83 EUR
Following these transactions, the Company now owns 1,042,415 own shares (0.65% of the total outstanding shares).
Euronav may continue to buy back its own shares opportunistically. The extent to which it does and the timing of these purchases, will depend upon a variety of factors, including market conditions, regulatory requirements and other corporate considerations.
I view this news release as an indication of the company’s desire to support the stock below the 8 euro ($8.80) level. Since the company reported 140 million euro ($154 million) as of March 31, it’s likely the company may again support the stock at below 8 euro ($8.80) in the event of another pullback in the stock. The news release may also embolden traders to buy shares of EURN at, or near, $8.80.
Trade Green!
Jason Bond
Good stuff! Thank you! How many of these long term trades have been green trades since the New Year?
Haven’t been counting but consistent with swing which is about 70% win rate. The wins and losses are in my trade journal with the swing trades.
For some reason, I can’t see the trading journal that you have posted. My computer doesn’t recognize the file format. How can I see it?
It’s an Excel sheet from MSFT.
MSFT? I’m not following :/ Do you have a direct link?
Sorry MSFT is the ticker for Microsoft. It’s a Microsoft Excel file.
when I click on your folder in the chat room. I can see every file you have there except for the Jason’s trading journal.numbers It’s so weird that I can’t see it and everything else I can. Could I be doing something wrong?
jason’s trading journal is an Excel file, do you have Excel on your computer? if not, download it free at Microsoft.
Found it in the day trading chatroom. I was looking in the millionaire road map chatroom and it’s not on xcel form. All good now…thank you.
So what will happen to FNMA if Trump loses?
There’s still a good chance FNMA profits return to share holders if Democrats stay in office.
Hello Jason! I just saw EURN in the Long Term Portfolio, but i did not get a “Buying-Mail” from you, just a mail that you bought GLUU and that you are looking to buy EURN. Did you realy buy EURN?
If you look at the GLUU email it said I’d be buying EURN before the close and at what price, what was the alert.