It’s going to be a holiday-shortened week, and typically, around this time — the volume slows down as traders spend time with their families.
Given the whole pandemic situation, this year might be a little different.
That’s why it’s business as usual for me up until Wednesday, and I’ll most likely take it easy on Friday due to the early close.
This week, I was able to lock in about a 50% win on TSLA options because I spotted — what I believe to be — a simple setup, as well as a key level.*
That said, I believe it’s important to identify reliable patterns and areas of value ahead of time.
Let me show you which patterns I see in some of my favorite stocks, and which levels I believe traders should focus on.
Key Price Levels To Watch In Some Of My Favorite Tech Stocks
Let’s take a look at Tesla Inc. (TSLA).
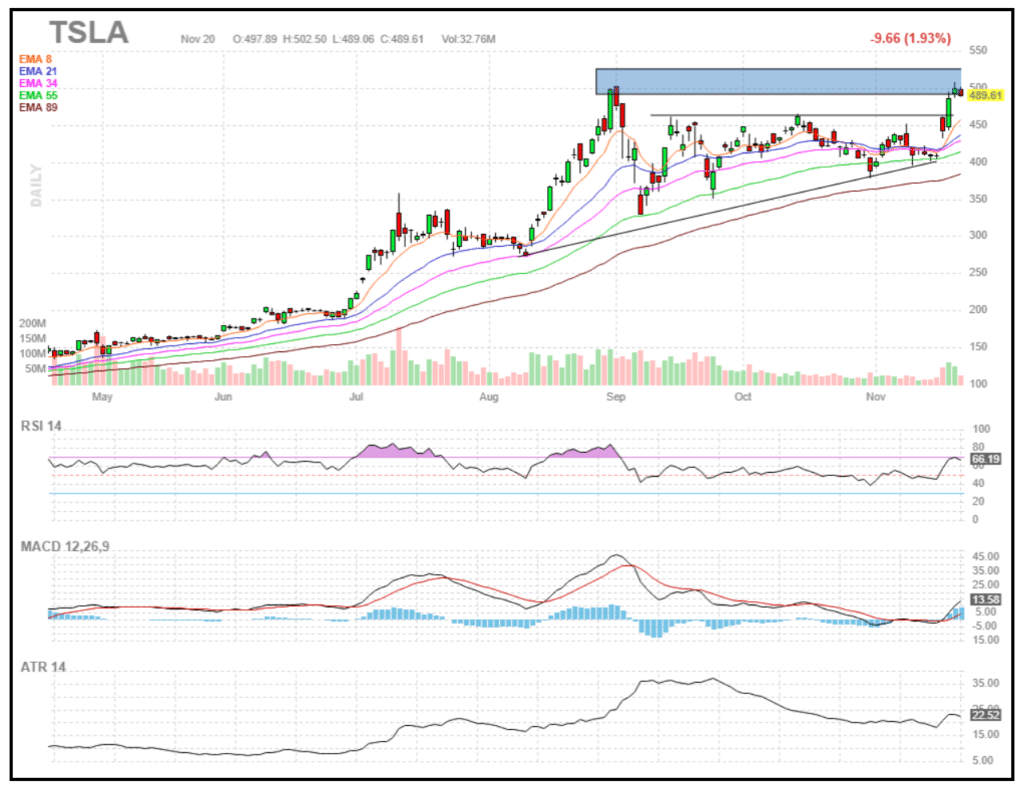
Notice how the stock exploded this week after it was announced it was going to be added to the S&P 500 Index. Now, I figured the stock would test the $500 the other day, and right now…
It looks as if there’s a double top. I want to continue to keep an eye on TSLA around this level. Given this pattern, I wouldn’t be surprised if the stock pulls back a little and tries to find support somewhere.
One key level to focus on for potential support if TSLA does pullback is where it broke out from that ascending triangle pattern (the $450 – $460 range).
Next up, we’ve got Alibaba Inc. (BABA).
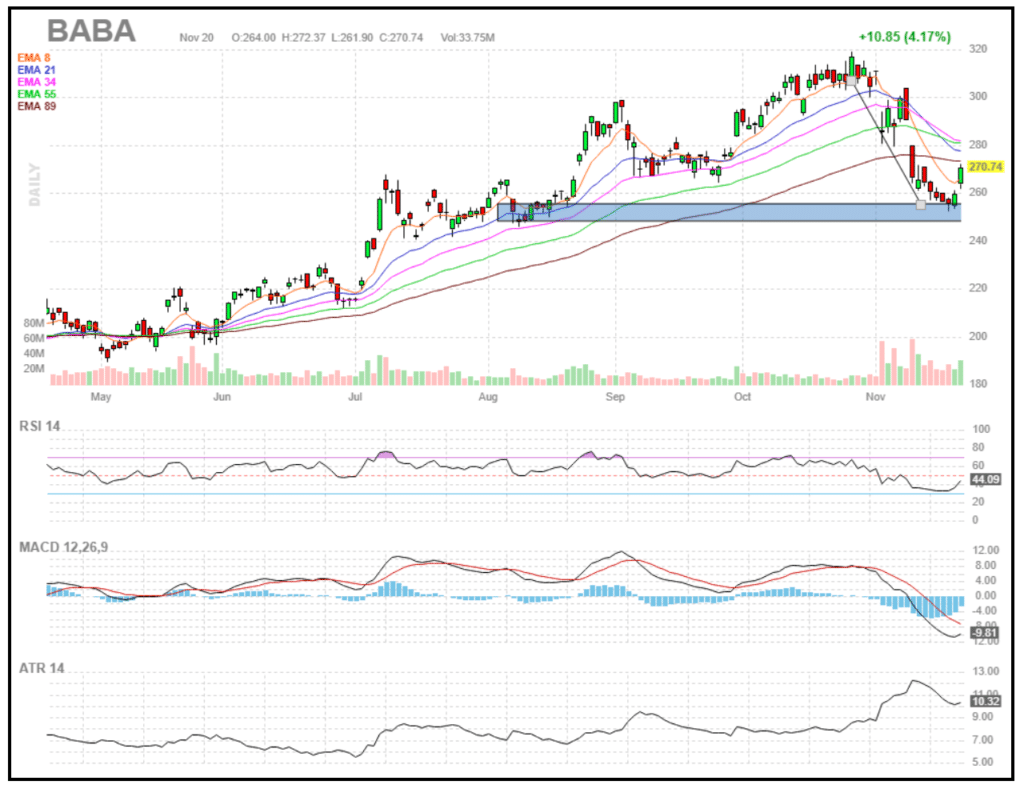
BABA actually was pretty close to oversold territory, based on the RSI. Now, BABA actually held support right around a key area and bounced.
If you look closely, you’ll see the fish hook pattern there.
With this play, I may look to the bull puts to potential play for a run higher, especially if it starts to break above key exponential moving averages (EMAs) on my radar.
Last, but not least…
We’ve got Apple Inc. (AAPL).
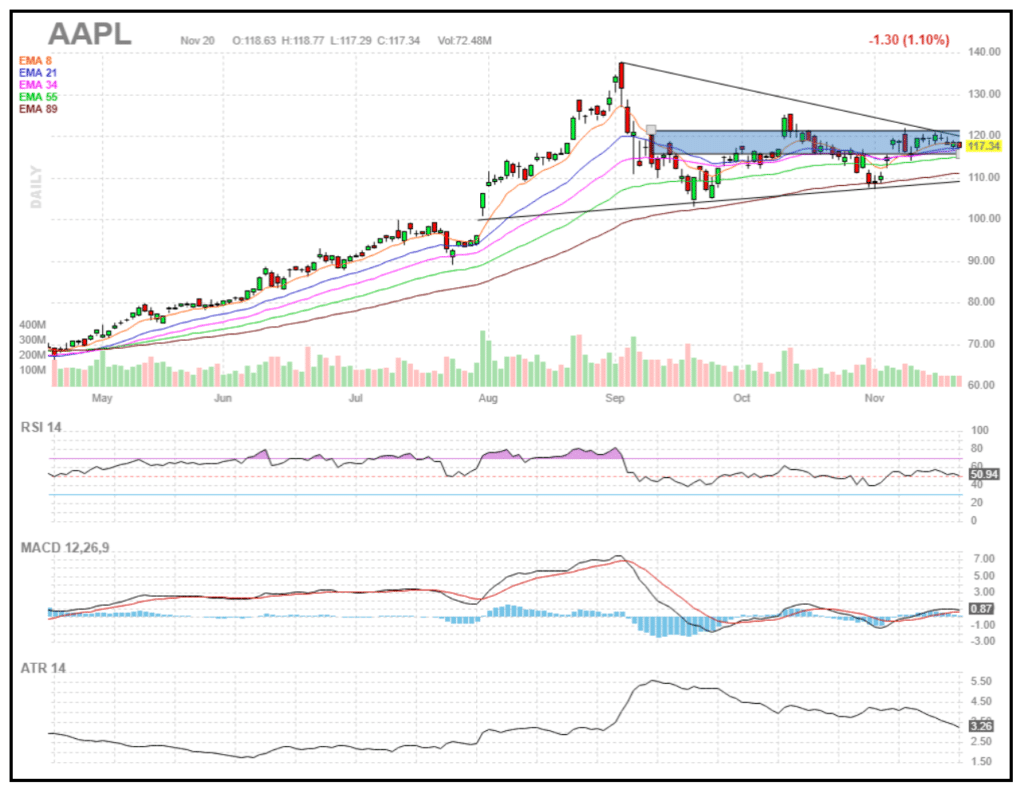
AAPL has been consolidating around this $115 – $120 area and there’s a symmetrical triangle pattern here. The stock actually looks as if it can break above that trend line, so I want to keep an eye on this area because that means I can potentially use bull puts to take advantage of a move higher.
Want To Trade With A Defined Edge?
In this market environment, I’ve found understanding price action is key. That’s why I put together this important training session to teach you two patterns I love to use every day.
By identifying my scalable and reliable patterns, I can trade with a defined edge and uncover momentum trading opportunities before they take off.
Let me teach you how my patterns work, and why I believe they can help make you a better trader.
Jason, Tesla is the best performing mega cap this year on a percentage basis. Last year, Apple was. Nov 23 2019 began Apple’s run. Monday Nov 23 2020 begins Tesla into Month End buying.. no doubt the s&p inclusion will influence. Street valuation is a 540 min. The setup has a heiken ashi breakout on the weekly within a quad bottom parallel channel. These breakouts have patterns that repeat on the weekly chart. The candle pattern breakout pattern for these is interesting too for high momentum stocks-definitely intentional.