At one point this week, Naked Brand Group (NAKD) was one of the hottest stocks…
It moved from just $0.09 to $0.33 at one point on Thursday…*
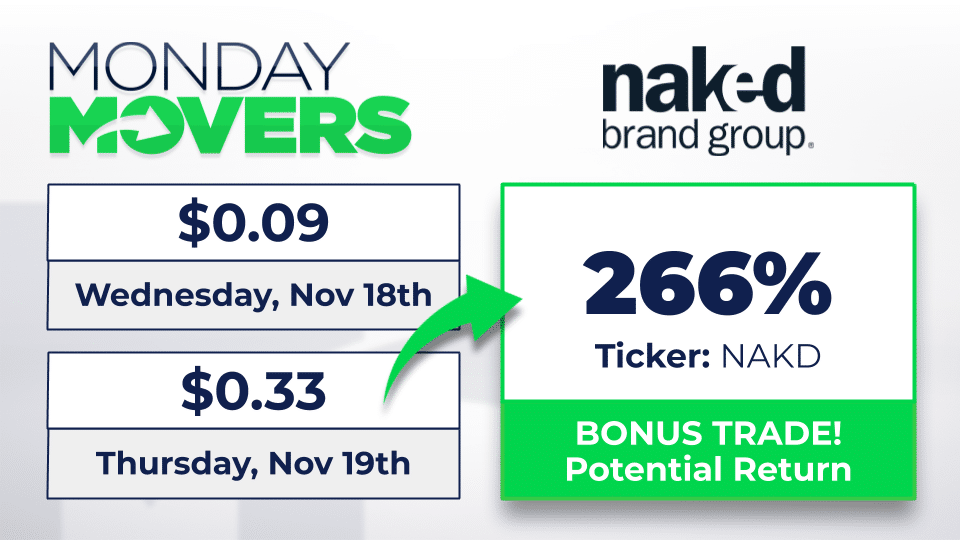
Now, I actually sent an alert about this play and let Monday Movers subscribers know about this setup. It just so happened to be a bonus trade idea.
Today, I want to walk you through this trade and show you the pattern I used to spot it…
As well as one trend I’ve uncovered in small-caps.
How I Uncovered A Monster Move In NAKD
Here’s what I sent out at 8:41 AM ET on Wednesday.
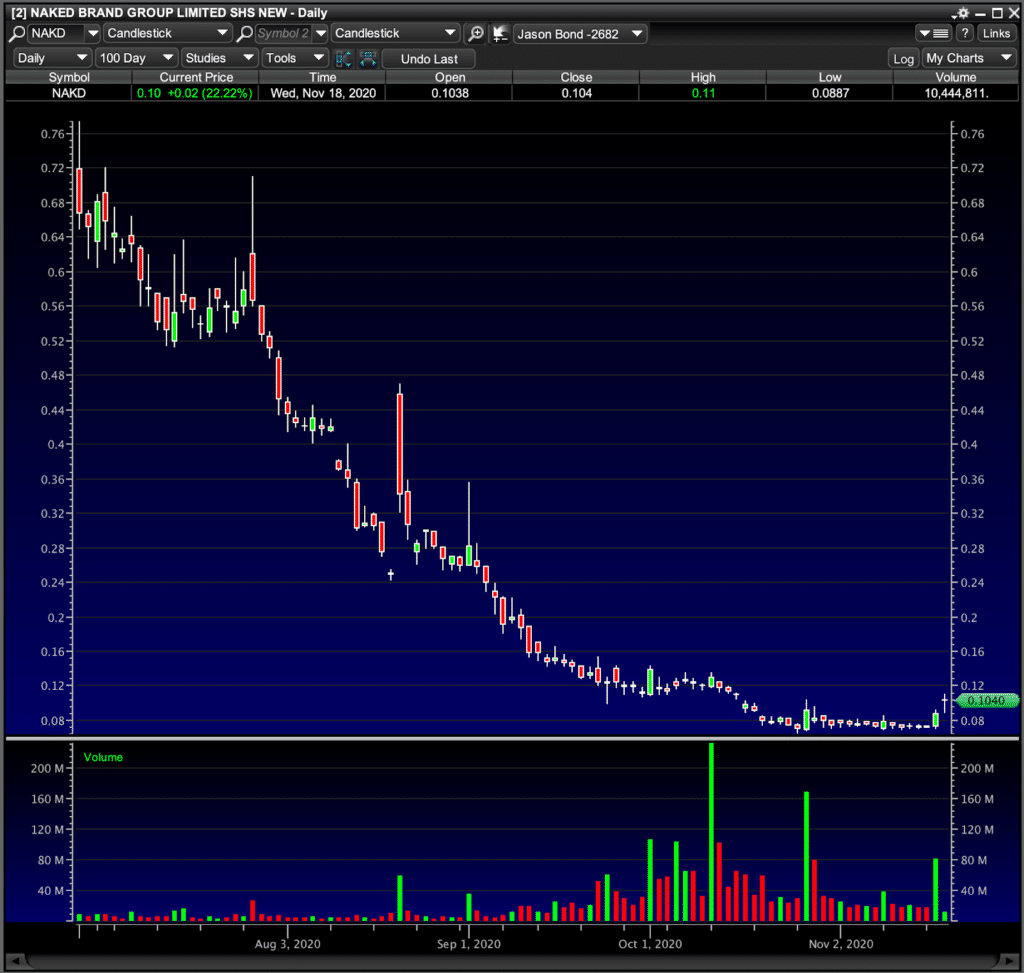
I’m watching NAKD this morning. Firstly, this is what I refer to as a ‘bankrupt chart’ even if the company isn’t in proceedings. That said, I’ll trade charts like this for short periods of time when I deem appropriate.
Volume spiked on this one Tuesday and Wednesday morning it’s back at it again with over $1,000,000 in liquidity as I type. So here’s the trade idea. In play above $.09, with a goal of $.16 if this works.
If I do get an entry here it’s likely a day trade or gap play and that’s it. Again, the overall chart is about as ugly as it gets, but the last 2-days are the setup I look for to trade short-term momentum. If the volume dries up I move on from these, it is not a good company but could be a good trade.
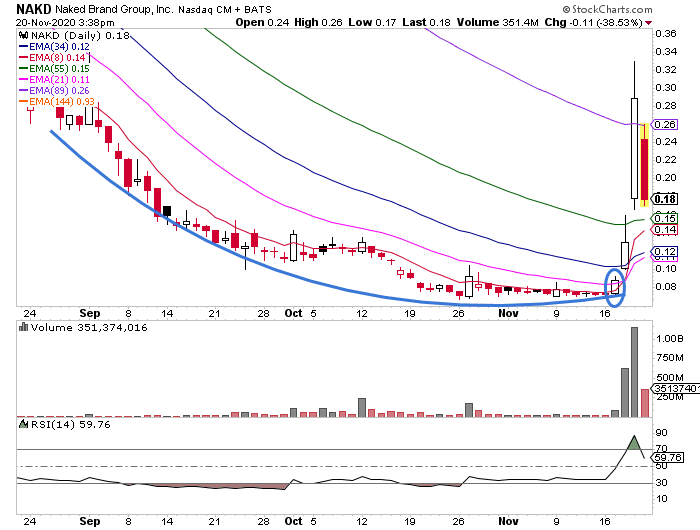
Notice how the stock actually found support and held, then started to pop on volume?
Well, that’s the one signal I look for and technically, this is known as the fish hook pattern for me.
Basically, I want to look for beaten-down stocks that found support and started to catch a bounce. Now, these plays are a bit risky, so I want to be nimble and get in and out (it can be a few days or minutes).
The key for me is to identify areas of value.
For NAKD, I liked above $0.09 as an entry, and $0.16 as the target. So risk-reward here, it was attractive. If the stock broke below $0.08, that meant the pattern was broken.
Now, NAKD actually got to the price I thought it would the day after I mentioned it.
Listen, there are plenty of opportunities out there such as the one you’ve seen above.
I’ve noticed a trend of beaten-down small-cap, low-float stocks exploding higher for brief periods.
If you want to learn how to uncover these plays, then you’ll want to attend my exclusive chart patterns training workshop.
You’ll discover my number one edge in the market, and two patterns I believe can make you a better trader not only in this environment but nearly any market environment.
Hi, Based on your info I actually tried to buy it at 0.11. However, it was moving up so fast and I didn’t want to chase it. You were spot on and it reached 0.16 and higher… and higher the next day. Thanks for sharing this bonus. No money made but gain some experience there.