With the way this market has been acting, the most important element to focus on is patience.
What I mean by that is only focusing on putting money behind my best trade ideas, and sticking to my game plan.
For the most part, my edge lies in chart patterns and I’ve actually been uncovering some explosive opportunities in the mid- and large-cap space.
The same patterns I’ve been teaching subscribers for about a decade are scalable and easily recognizable in my opinion.
I want to show you one of my favorite setups and how it helped me generate a 50% on JD calls.
The Rest & Retest Strikes Again
One of my favorite patterns to use is the rest and retest pattern. It works great for explosive small-cap stocks, and even large-cap stocks like JD, which has more than a $100B market cap.
Check out the chart in JD below.
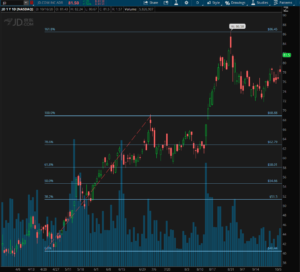
If you notice, I found the high and low points dating back to May and June. With that, I was able to uncover a key target level, the 161.8% Fibonacci extension.
This tool is one of the most powerful indicators I’ve come across, and I truly believe if you understand how to use it, you can identify opportunities in the market.
To be honest with you, once I find the swing high and low points, my platform does the rest for me. For this trade, the low I found here was about $40 (that’s when the stock started to take off.
The high point here was $68-$69. So you can actually do this ahead of time and write down some key levels.
For example, the 161.8% extension level is a target for me. That means if the stock broke out from $68, I can look to take profits around there (that’s more of a longer-term trade idea).
For me, when I noticed JD was pulling back into and looked as if it could test that 100% retracement (the area where it broke out from), there was demand there.
Once it started to turn, I had this stock on my radar.
Although I missed out on the trade before, I wasn’t going to miss it again, especially when one of my favorite setups materialized.
Now, JD is a pretty expensive stock, and at the time I got in the stock was trading in the $76 – $78 range.
Instead of using a large chunk of capital, I looked to the options market and the calls expiring in about five weeks from when I purchased them looked attractive.
On Tuesday, Oct. 6 at 2:48 PM ET, I let my subscribers know I was made a move.
I bought 20 JD $77 nov 13 call for $5.60.
Remember how I mentioned I was looking for a retest of the 161.8% extension level (around $85-$87)?
Well, the stock actually got pretty darn close to it.
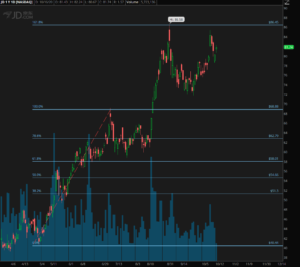
Although it wasn’t a massive move in the stock…
Those calls exploded because of the leverage the options provide. In less than a week, I locked in a 50% win on those calls, and here’s what I sent out on Oct. 12 at 1:55 PM ET.

The patterns I use are working right now, and I want to show you how they work.
I get it, you’re probably into trading options on mid- and large-cap stocks, but I urge you to attend my Chart Patterns training workshop.
You’ll discover the chart patterns I use to hunt down small-cap momentum stocks.
The thing is, you can take those same chart patterns and apply them to large-caps, just as I did with JD.
0 Comments