There’s one area in the market that offers the most explosive opportunities time and time again…
Small-cap momentum stocks are where it’s at, and if you don’t know how to trade them or just don’t know where to start — listen up.
There is a simple process, in my opinion, that can help you identify some of the hottest small-cap momentum stocks before they take off.
Listen, I’ve been teaching traders how to trade momentum stocks for a decade, and right now is the time when I can make money easily.
Today, I want to give you an inside look at four key indicators to consider before trading any small-cap stock…
When combined with my favorite chart patterns, understanding these will give you edge, in my opinion.
4 Key Indicators To Hunt Down Hot Momentum Stocks
I’m going to cut to the chase here, and tell you about a process I believe can help you right now.
1.Look For A Catalyst
This one is often overlooked by traders who are too lazy to do any homework.
More often than not, they even get away with it because they trade purely on the technical analysis of the stock.
However, every once in a while, they find themselves in a sticky situation when technicals don’t really matter.
I am talking about situations such as when a company declares bankruptcy, gets investigated by the SEC, achieves primary endpoints in a phase 3 drug trial.
Think of knowing a catalyst (or absence of one) as putting on a seatbelt in your car: 99.99% of the time you will not need it, but that 0.01% might save you.
On the other hand, trading on the side of the catalyst gives you a higher probability for the trade to work.
For example, GoPro (GPRO) is one stock that had a recent catalyst, after the company announced positive results for its subscription service last week.
This week, the stock was still gaining momentum, and it was actually on my daily watchlist on Wednesday.
Here’s what I sent out to subscribers.
GPRO continues to be a favorite of mine right now and has been delivering decent dollar profits the last few trades. When I look at the chart it’s in play above $6.50 for me with range to $8. I like to trade this name bigger and look for 3-5% moves.
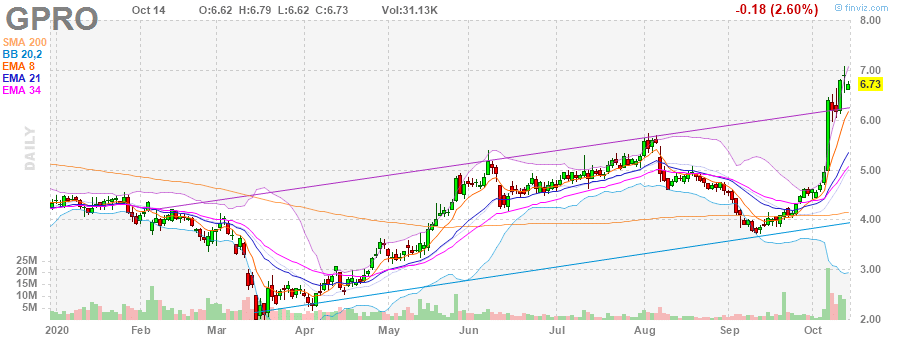
I paired the catalyst with one of my favorite chart setups, the bull flag / bull pennant pattern and continued with my research.
The next key indicator to look at is the float.
2.The float of the stock lets us know about the supply out there for traders
Why is it so important?
The float indicates how many shares are circulating and available to be bought or sold by the general public.
The number is calculated by subtracting any restricted stock from the total amount of shares outstanding.
The critical part of the float is that it often has an inverse effect on the volatility.
Basic supply and demand – if the demand is present and supply is limited, the stock has a higher chance to go up.
Whenever you hear about stocks that go absolutely crazy (like DRYS went from $3 to $100 within 5 days back in 2016), they are usually low floats.
With GPRO, the float is about 127M, and while it’s not a low float… there really aren’t that many shares available, when you compare them to large caps.
Next up, another indicator to use in tandem with float is the short interest.
3.Short interest tells us if there can be an uptick in demand.
Short Interest is how many shares are being sold short. It is usually expressed as a percentage.
For example, If the float is 100k shares and 20k shares are being sold short, then the short interest is 20%.
It is also something that affects the supply mechanics: while short interest is not a part of the calculation of the float, in reality, it further limits the amount of stock available to buy.
If the stock starts rallying and the short interest is high while the float is low, short-sellers will start covering their shares circulating the same limited supply causing what is called a short squeeze. Which in turn causes other shorts to feel the pain and cover even higher. Think of it as a short-seller stampede.
So GPRO had about an 8% short interest, and on 127M shares… that’s a pretty hefty amount of shares short. In other words, if the shorts get squeezed the stock had the potential to break out.
4.Easy to borrow vs Hard to borrow
Shorting a stock isn’t always free.
To get short, the broker has to be able to borrow the shares and deliver them to their new owner by the settlement date. Shares of a stock you’re trying to get short can fall into one of the following categories:
Easy-to-borrow (ETB): a lot of borrowable shares are available
Hard-to-borrow (HTB): few shares are available and if you want to get them – you’ll likely have to pay a fee
None-to-borrow (NTB): your broker can’t find any shares and getting short isn’t possible
This metric can be a good indicator of how aggressive short sellers can get and therefore, how likely they’re to end up in a bad spot.
Sometimes, low float stocks will have ETB shares on day 1, which attracts the shorts. Then on day 2 or 3 a fresh set of buyers comes in and triggers the shorts from day 1 to cover. That cycle could go on for multiple days. Ultimately, on the day the stocks finally top out, shares are almost always HTB or NTB.
The last indicator just improves the conviction, but to me… the first three indicators will be crucial.
So let’s go back to GPRO. I actually bought shares on Wednesday around noon… and here’s what I sent out to my subscribers.
bought 20k GPRO at 6.91, looking for that 7.10-7.20 move here as it continues to consolidate nicely in a bull flag, also think market heads up from here. probable day trade, possible swing if i’m right about market.
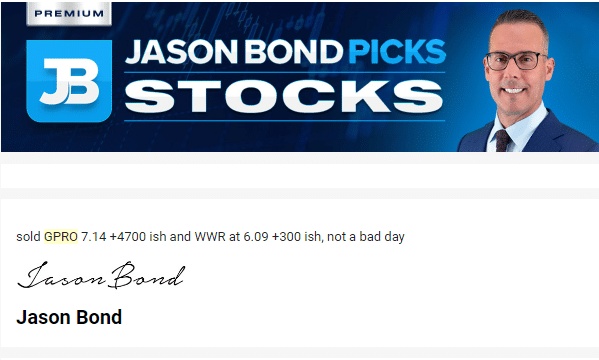
On Thursday, the stock got to my target, and I locked in about $4,700 on an overnight swing.*
I’m not telling you about this trade to brag, I just want to show you that I’m identifying these plays with minimal work.
To be quite honest with you, if you’re able to uncover momentum trading patterns (such as the bull flag / pennant) and understand these indicators… you can become a better trader.
I get it though, you might not know where to start… that’s why I want you to attend this exclusive training session that details my three favorite momentum trading patterns and how I utilize them to uncover hot stocks before they take off.
I have. ? Ok I’m a shareholder for Facebook ,telsa, and Nike I bought these stocks threw cash app. Now Facebook feel,n Nike send me documents ……I’m just not sure what to do I haven’t received any kind of money .and I know the stocks have been going up what do I do
Hi Jessica. Because we are not financial advisors, we cannot legally give you advice on how to manage your money. However, your broker can most likely help.