Tesla Inc. (TSLA) has been on fire this week and made all-time highs yesterday.
Its long-anticipated debut on the S&P 500 is about to happen soon, and that can spark even more demand for shares of the high-flying tech stock.
Of course, when I saw the catalyst and looked at the chart pattern — it signaled the stock had the potential to run to $500 (which it did yesterday).
I want to show you how I spotted the play, and why it’s important to pay attention to the key level and price action.
The Chart Pattern That Signaled The Massive Move In TSLA
While the catalyst sparked the move higher…
It was the pattern that let me know the stock could explode and test the $500 level.
I know I sound like a broken record… but here’s what I sent out on Tuesday
TSLA of course is all the rage today and I think, based on the pattern, $500 isn’t out of the question. So my goal is to sell $450 / $440 or slightly lower for $4 premium if it dips a little into some gap recovery today. Expiration for this Friday and next Friday make sense to me here.
I would like to make both of these trades today and will keep you posted if I’m able to get the premium I’m looking for. Nasdaq is light green this morning with the Russell, Dow and S&P all light red.
My subscribers know which patterns I’ve found to be reliable, and let me tell you a little bit about this one.
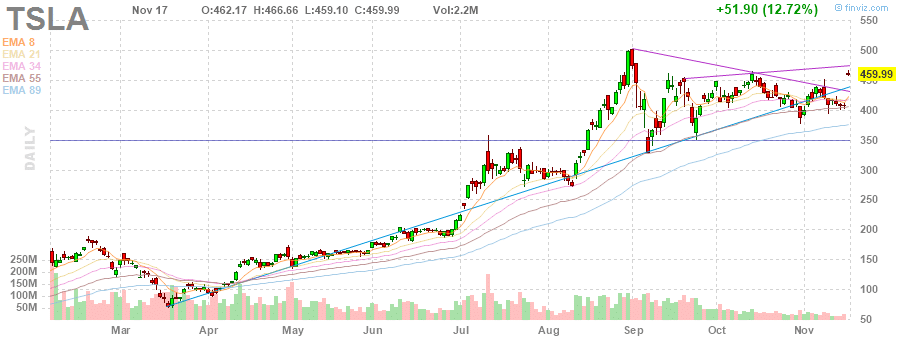
If you look above, there’s an ascending triangle pattern there. The resistance level was around $460, and typically, with this setup… the stock breaks out and continues higher.
Now, if you recall, TSLA’s previous all-time high sat around $500 (of course adjusting for the stock split).
So that breakout pattern let me know it had the potential to test that level.
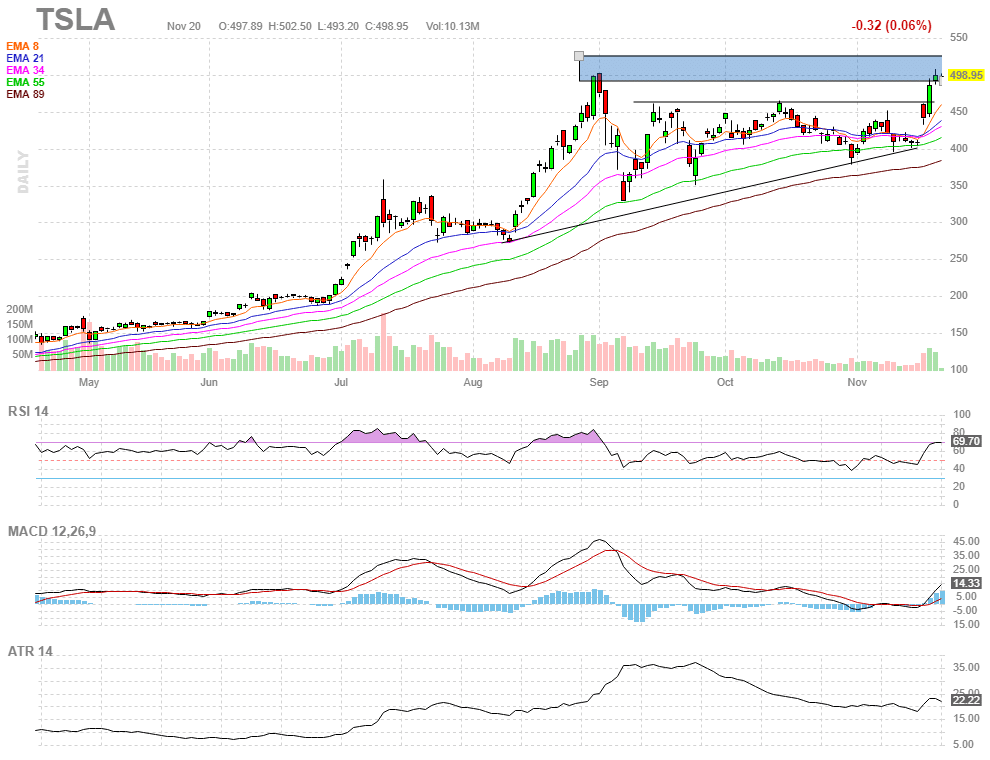
Check out the updated chart in TSLA above. It broke above that previous resistance level around $460 and just rocked higher and is now testing the $500 level.
Listen, with the way TSLA just moved, I wouldn’t be surprised if TSLA pulls back a little here. However, that doesn’t mean I’ll bet against it.
I’ll keep an eye on the price action and develop a plan if the stock find support around $450 – $460, which may signal TSLA would try to go for a triple-top breakout.
If you want to learn more about chart patterns and how I utilize them to uncover breakout trades… then you’ll want to attend this exclusive training workshop here.
With the way the market is acting, I’ve been able to find some “certainty” amidst all this volatility and trade with a defined edge.
Register for the session here.
Hi Jason, Thank I for the up date !! So far I’m up 37,000 on Tesla before it all began. Have a great weekend!🍻