Although there’s been a lot of back and forth action, there’s one area that’s still filled with opportunities… even as the trading week comes to an end.
Today, one of the hottest stocks on the momentum hunter scanner was Socket Mobile (SCKT).
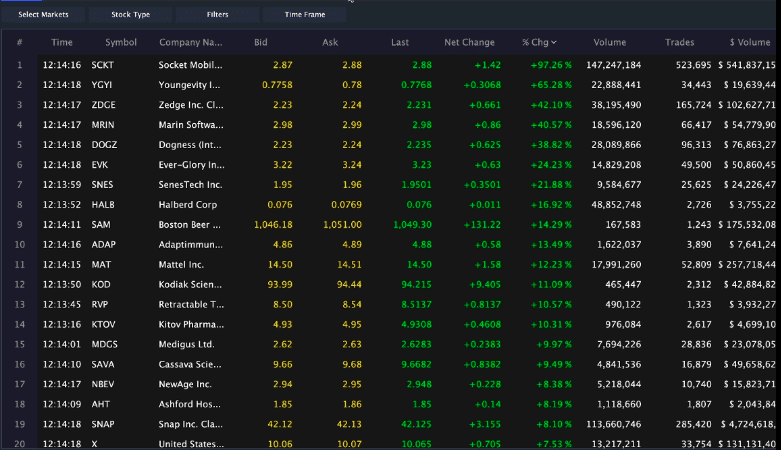
At one point today, the stock hit a high of $4.50 and quickly pulled back. However, this is actually typical with momentum stocks. The FOMO chasers bid the stock up and then the profit takers come in at one point and sell shares.
The thing is, there’s actually one pattern I want to teach you today because I think it can help you when it comes to developing trade plans.
That said, let’s take a look at SCKT, and what key pattern I’m watching, and what this signals about the price action.
Socket Mobile (SCKT) Takes Off After Earnings, Here’s The Pattern I’m Watching
On Thursday, SCKT shares took off after the company reported third-quarter results. It’s a barcode-scanner maker, and noted the results were incomplete. What really caught my attention was the pattern I noticed… I’ll get to that shortly.
First up, SCKT only has 4.70M shares floating, and that’s one factor that caught my eye. You see, this signals to me that there aren’t a whole lot of shares available to trade. In other words, there’s not a whole lot of supply out there, which is great for small-cap momentum stocks typically.
What really caught my eye was this setup…
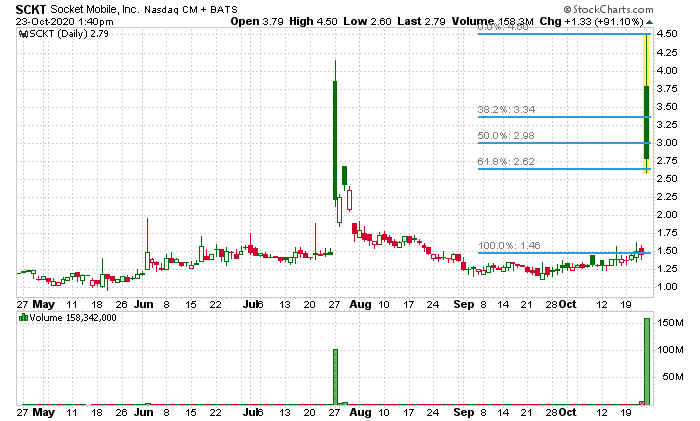
This is known as the Fibonacci retracement. I love to look for this setup when a stock skyrockets.
You see, I’m able to identify key potential entry levels. So after SCKT ran from $1.50 to $4.50 and started to pull back, I quickly drew the chart pattern and found some key levels. The 61.8%, 50%, and 38.2% levels are on the radar.
Notice how SCKT pulled back into $2.62 (the 61.8% retracement level and held) and started to pop a little? Well, that’s typically what I see with this setup. If these levels hold and the stock stocks to run up again, it signals to me it may retest the high.
That said, this one is on my radar.
Listen, there are plenty of momentum stocks out there to take advantage of. I want to teach you how I find them utilizing some of my favorite chart patterns.
I’ve detailed them in this Chart Patterns training guide here.
Claim your complimentary copy here.
*Results presented are not typical and may vary from person to person. Please see our full disclaimer here: ragingbull.com/disclaimer
0 Comments