This week’s account builders absolutely crushed Wall Street. What are account builders you ask? Click here to read about how I’m trying to help anyone building a smaller account into a bigger one. Considering yesterday’s market, it’s only fitting to go hunting for one last winner to finish off a fantastic week of scans. Today’s ideas are between $1 and $2 and are all continuation patterns that were not up significantly Thursday and could be set to explode today if the market stays strong. First this week’s winners followed by my thoughts on KERX, ASTX and SNV for today.
20% return on QTWW – read more
42% return on NBS – read more
58% return on AONE – read more
11% return on GERN – read more
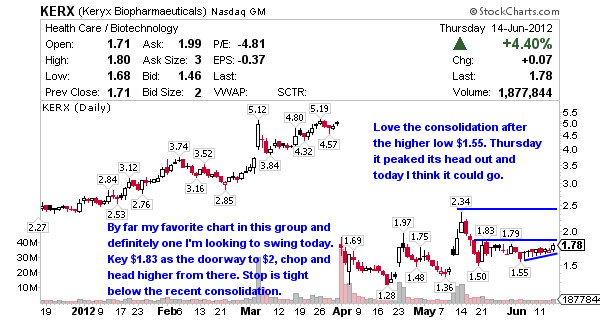
Keryx Biopharmaceuticals (NASDAQ:KERX) is a biopharmaceutical company, together with its subsidiaries, focuses on the acquisition, development, and commercialization of pharmaceutical products for the treatment cancer and renal disease. KERX’s stock market cap is $127 million with a wonderful Beta of 2.29, definitely in my wheelhouse. By far my favorite chart of the group, especially when you look at the continuation pattern just starting to peak it’s head out of consolidation. Given there’s a short interest of 15 days to cover and 28% of the float short I’d definitely be looking to move on this today if the market is green and the price action is creeping toward the low $1.80’s which is resistance. If $1.83 falls on volume this is a $2 magnet and probably today. I’m a 5-10% trader rinse and repeat so this 32% channel up to $2.34 resistance is very attractive to me.
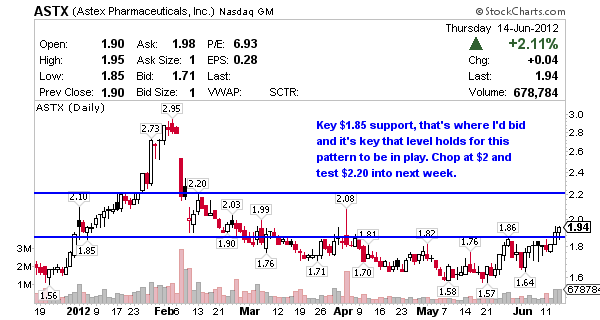
Astex Pharmaceuticals Inc (NASDAQ:ASTX) engages in the discovery and development of small molecule therapeutics with a focus on oncology and hematology. It develops small molecule therapeutics using its fragment-based drug discovery platform, Pyramid. ASTX’s stock market cap is $180 million with a Beta of 1.45. Up 2% on Thursday the chart definitely appeals to me if it opens above $1.94 and holds that range. Look for it to test $2 then and if volume is present $2.20 is reasonable at which point I’d expect chop. That’s a 13% channel from here to there, not sure it goes much more than that give the Relative Strength is already 64.82 but remember, back in January when ASTX ran it ran overbought for a full month before pulling back, so it definitely has a history of holding elevated levels. The short interest here is 14 days to cover with only 4% of the float short. I think volume and price action are the key here, so be watching the Level II for signs mentioned above.
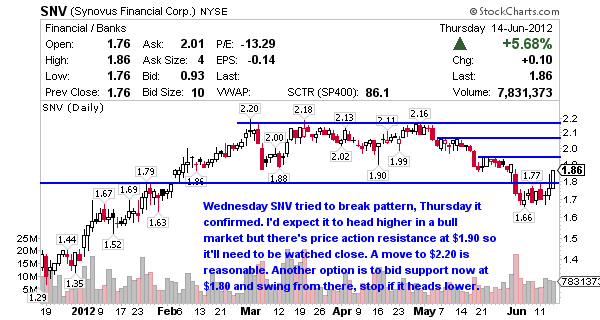
Synovus Financial Corp. (NYSE:SNV) is a financial services and bank holding company, provides integrated financial services in Georgia, Alabama, South Carolina, Florida, and Tennessee. SNV’s stock market cap isn’t necessarily worthy of the account builders filter at $1.46 billion but there weren’t a lot of great setups between $1 and $2 so I had to move up in cap to find a chart worth writing about. Recently SNV consolidated just above the 200 Moving Average and made its move above the 20 Thursday. SNV is typically a slow mover but it does have a Beta of 2.25 so it could produce another 5% win today if it climbs to the $2 range. Given the strong close Thursday I think something around $2 to $2.10 is reasonable but only if it opens above Thursday’s close. Don’t count on shorts to bid this one up, the short interest reported is 8.4 days to cover with 7% of the float betting against the trade.


Is there a page you’ve created that explains all these terms? (chop, bid support, resistance, move, break, test, etc.) I’m clueless as to what all these terms mean and it’s a bit overwhelming to a new trader like myself. I signed up for your free try-b4-u-buy program and I’m gonna be honest… I’m not sold. I’m just more confused.
Hi Jimi, like anything learning takes time and yes, much of that terminology is defined once you become a paying subscriber. I don’t have the time to teach free subscribers everything though, sorry but that’s what I get paid for.
Hi Jason,
I’m about to start your program. I’ve been trading in my sparetime from university. It has somtimes been very profitable. But recently the market have worked against me. So im seriously considering to start your programme.
I’m attached your trial subscribe-letter. And when you called NBS and compared to where you could have have excecuted out – is not actually correct in my opinion. It looks like a decent gain but don’t you exaggerate just a bit?
Best regards,
Anders from Denmark
Hi and welcome, I wish you the best of luck. Regarding NBS, I didn’t trade it so I’m not sure what you’re talking about?
I personally traded NBS and got in just at breakout as per the chart Jason drew up at .45 (Actually .4498) and sold at .55. That was over 20% gain in less than 24 hours. Jason’s graph with notations and notes pointing where resistance and support are makes it easier for rookies like myself.
I also traded QTWW, as per Jason’s account builder setup. Bought at support at .66 and sold at .77 on a short swing. Waited for a breakout past .80 but it didn’t happen.
Jason a nice cheat sheet with the terms used and the actual definition with an example would be so much appreciated! lol
Awesome trades David and yes, a terms list is definitely on my list of things to do.