There’s fear in the market…
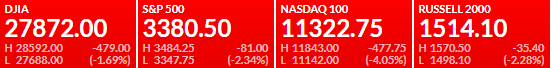
The market is getting smoked in this tech-driven selloff, and traders are wondering if this is just a pullback…
Or the start to a selloff.
To be honest with you, I think this is just a pullback — but that doesn’t mean I’m going to just buy stocks blindly.
If the price action signals further downside momentum, I may look to play that as well…
I’m going to keep a close eye on the charts and remain patient.
Right now, there are specific levels in major ETFs I have in mind, which can help me better time my trades.
So what are my thoughts on the market and what am I watching?
When In Doubt, Price Action Reveals All
With the market selling off into the holiday-extended weekend, traders may panic and not look to hold their positions.
Who really knows.
Rather than trading off emotions or superstitions, I’m going to let the charts tell me when I should get in on the action.
Check out the SPDR S&P 500 ETF (SPY).
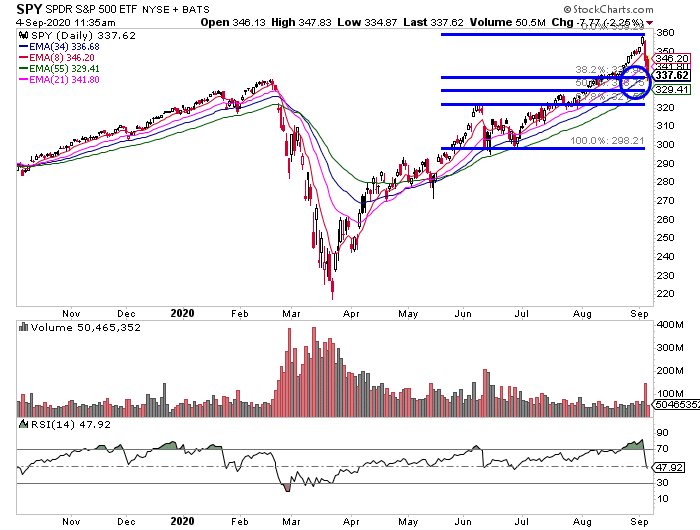
On the daily chart, it’s right around a key level Fibonacci retracement level.
The $335 and $328 area may be a line in the sand, after all it was a previous high dating back to February.
I believe the markets will respect this area, and if it breaks below, things could get ugly.
If SPY breaks below those key areas, the next line of defense is $321 (the 88-period exponential moving average).
The moving averages and Fibonacci retracements have held up well over the last few months, and they can signal when demand can pick up.
Next up, we’ve got the Invesco QQQ Trust (QQQ).
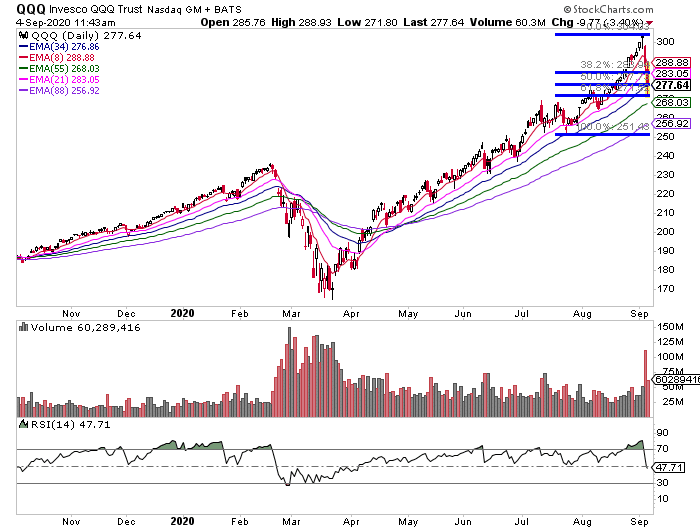
The QQQ is right at the 61.8% Fibonacci retracement level, and this is one area where there can be heavy demand. However, if it breaks below, I’ll look for the $268 area (the 55-day EMA) to potentially establish some longs.
Last, but not least…
I’m keeping a close eye on the iShares Russell 2000 ETF (IWM).
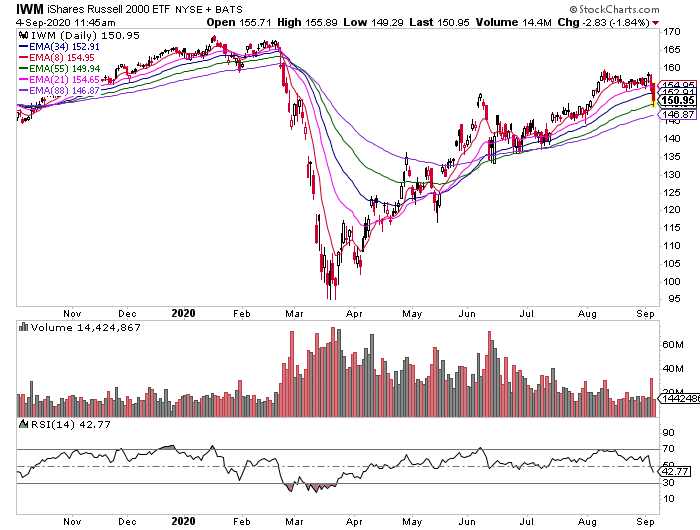
With IWM, I’m really focused on the exponential moving average (EMAs), as you can tell, there are specific ones the market tends to respect.
If they get broken, then it’s important to look for the next line of defense.
For example, I’m keeping an eye on the 55-day and 88-day EMA. If there is no demand at those levels, and the selloff continues… I may look to take some bearish positions.
My patterns will let me know when it’s time to get into specific trades, and help me identify when a stock or sector is likely set to move.
If you want to develop the skills to trade off price action and not have to rely on news…
Then check out my exclusive training workshop here.
0 Comments