Good morning,
Stocks, banks, copper and the US dollar were all losers this week, as the blame for this week’s poor performance of these markets is assessed to politics in Washington. With the defeat of a bill that would effectively gut much of the Affordable Care Act (ACA), the first test of the Trump presidency resulted in failure, but more importantly the bursting of the bubble of half the nation’s high sentiment.
Sentiment is critical today, so the failure of repealing the ACA by the Trump administration should not be taken lightly. The wildly positive sentiment that has been driving the Trump rally is a testimony of this fact.
Polls show sentiment has been terrible among Democrats since the US election, while sentiment has been very high among Republicans. With this failure, how many Republicans will remain faithful and optimistic about the bright future of the economy Trump has painted?
Led by the banks with the 4.73% plunge in the KBW Bank Index (BKX) this week, the DJIA, S&P 500, NASDAQ, Russell 200 and DJTA also retreated throughout the week. Dr. Copper hit the skids with a 2.25% decline, failing again to surpass its 200-week moving average. And the US dollar took another ride down to close within $0.44 of the all-important 99 level.
Okay, let’s hearken back to my March 6 report, where I quote former OMB Director, David Stockman (1981-85), of the Reagan administration (1981-89) in reference to the important date of March 15 and the tragic events he postulates are coming as a result of the sharp divide between Trump versus the Democrats and many Republicans.
Stockman told Fox News:
I think what people are missing is this date, March 15th 2017. That’s the day that this debt ceiling holiday that Obama and Boehner put together right before the last election in October of 2015. That holiday expires. The debt ceiling will freeze in at $20 trillion. It will then be law. It will be a hard stop. The Treasury will have roughly $200 billion in cash. We are burning cash at a $75 billion a month rate. By summer, they will be out of cash. Then we will be in the mother of all debt ceiling crises. Everything will grind to a halt. I think we will have a government shutdown. There will not be Obama Care repeal and replace. There will be no tax cut. There will be no infrastructure stimulus. There will be just one giant fiscal bloodbath over a debt ceiling that has to be increased and no one wants to vote for.
So, Stockman got this right. Didn’t he? Although I was too young to remember David Stockman when he was making headlines for his rigid honesty during the Reagan administration (which Reagan didn’t like), I was told Stockman really knows the ‘inside ball’ of Washington, and, therefore, his thoughts have been included in the building of knowledge base.
After this defeat to repeal the ACA, the Democrats must now smell blood, for sure. Since Friday, I’ve had a stronger feeling about what Stockman had been parading around his dire predictions to any media outlet willing to have him speak, in early March.
I’ve spent two-weeks worth of preparation for these reports and occasional restless evenings thinking and talking about the potential catalysts for a market turnaround in stocks to a ‘correction’ mode, knowing in my gut one of the three events of March 15 would most likely come back to create a problem. Well, the action in several markets tell me I’m not alone.
Let’s get into the ‘evidence’ of the deterioration in the markets brewing under the surface, and I’ll let you decide if my apprehensions match David Stockman’s warning about what’s in store for us in Washington and, of course, the logical implications inferred onto the stock market.
First, the VIX is rising again, but let me introduce another stock market sentiment indicator into the overall picture of assessing market sentiment: SKEW. The SKEW is an index that calculates index options bought and sold at strike prices suggestive of ‘tail-risk’ hedging. ‘Tail risk’ is a term used to denote the risks associated with statistically improbable moves in a direction against a trade . One could state that a move of three standard deviations (approximately less than 1% of the time) from the mean of an historical data set is a ‘tail move’. As a means of mitigating or removing risk, traders may buy out-of-the-money calls or puts, just as a homeowner buys fire insurance to protect the asset value of his house.
The chart, below, shows the SKEW declining sharply this week, but notice the trend and level to which the SKEW retreated this week. Even after the substantial decline in the SKEW by the close of trading Friday, the level of 136.62 is still mighty high (blue shading).
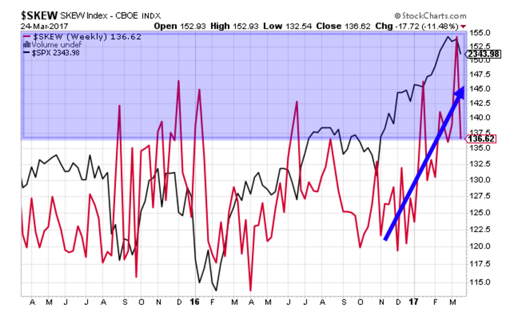
That pull back in the SKEW to a still-high reading intimates to me the extreme SKEW reading the week before Trump’s first confrontation with Congress is still flashing fear. But, even after a modest pull back in stocks that appeared to be the result of the Trump administration failure did not move most traders off their tail-risk hedging ways. The reading of 136.62 is still relatively high, considering a relatively modest pullback in stocks.
You know, maybe the very active traders moved back to pare their insurance costs by Friday, but the longer-term traders did not. I cannot prove that assumption, but from my experience with talking with traders at all levels of expertise and responsibility (hedge fund guys to modestly-capitalized individual traders), the big boys don’t move in-and-out as much as the more short-term-focused day trader do.
Okay, let’s now talk about what I covered in last week’s report: the hidden decline of stocks against another metric: dollar-gold. As a reminder, I wrote:
Another way of looking at this week’s price action in stocks is via valuations in other currencies, as, in terms of yen, Sterling and gold. In terms of these metrics, essentially, US stocks sold off, with the rise of the dollar-gold price of 2.4% besting the big moves higher in the yen and Sterling.
So, in all, nominal dollar-denominated stocks prices didn’t rise enough to compensate for the loss of purchasing power of the US dollar. What happened during the second half of the week was a international repricing of the US stock market downward. That’s the way you should look at what happened this week.
Well, my friends and colleagues, the market action this week highlights my point about watching for the stealth decline in purchasing power of US stocks. This week, the DJTA and the dollar-gold price whacked the purchasing power of stocks a lot more. While some traders placed out-of-the-money protection (a suggestion of mine in last week’s report), others took another suggestion of mine, which is, to hedge stock portfolios with gold bullion.
Let’s see what happened this week in the trend I see developing between the gold market and stocks. Since, the DJTA is, traditionally, a leading indicator of the industrial stocks, I’ll illustrate my point again about the underlying deterioration of stocks by showing the damage already done in transportation stocks via the dollar-gold. The chart, below, may help you make more sense about what’s happening since the US presidential election in the relative value of the US dollar (against dollar-gold) and the impact that weakness has had on stock valuations.
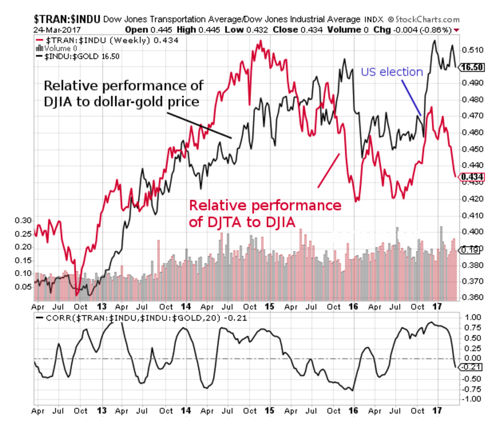
So, what does this chart tell me? It clearly tells me that, either the DJTA starts to make a big comeback relative to the DJIA, or the DJIA must fall relative to the DJTA, or the gold price must rise relatively faster (or relatively slower, in the case of both assets declining in price) than the DJIA—if historical relationship still remain valid.
As a trader interested in this discussion, proverbially-speaking, what would you do on Monday morning? Answer: we watch for an opportunity to go long GLD and short the DJIA. Or, we go long the DJTA and short the DJIA. Or, we go long the DJTA and GLD (weighted and totaling one trade unit), and short the DJIA.
Since I’ve already made this suggestion, in respect to hedging in the gold market, the opportunity still exists. One factor to watch for in the timing of this trade, however, is the upcoming action in the gold market on Monday and Tuesday. Tuesday is options expiration in the gold market. For as long as I can remember, the two days leading up to option expiration elicit a ‘gold raid’, a smashing in the dollar-gold price as a way of making sure call options expire worthless.
Bullion banks and others involved in the capping of the gold price derive income from selling call options. Therefore, raiding the gold market as the price of dollar-gold rises into option expiration becomes a handy way for bullion banks to make some revenue. Okay? Watch for an opportunity on Wednesday, is my guess. Who knows if the physical market dominates the trade this week, or not.
And as a side note:
So far, my idea to think about going long US Treasury 10-year note is working out. The yield of the US 10-year has dropped 20 basis points (price of bond trades inversely to yield) since my observation.
And my widening of the gold/copper price ratio is also working out. I’ll cover these two ideas in another edition of these reports, especially if big moves are made.
Okay, let’s talk about stocks.
My current portfolio: LQMT, CROX, LC, ANGI and GRPN
This Week’s JBP Stock Ideas
There were no trades this week.
LC received a ratings upgrade from Wedbush to ‘neutral’ from ‘underperform’. Other than that upgrade to LC, no other company-specific news was released this week for the four other of my holdings.
MY WATCH LIST
SIENTRA (SIEN)
Sientra (SIEN), a maker of silicone breast implants and a budding successful turnaround story from an unfortunate factory stoppage at its third-party manufacturing facility in Brazil, Silimed Industria de Implantes Ltd. A little more than a year ago, due to a European regulatory agency issuing a marketing suspension of all products made at the Brazil plant, after flaws were found in some silicone implant products made at the facility, trouble came to Sientra, but through no fault of theirs.
Although Sientra manufactured implants at the plant employed production standards approved by the US FDA, and were independent of other processes at the facility, Sientra voluntarily suspended operations in September 2015 until a third-party inspector verified Sientra’s implants were not among those produced by the methods of other Silimed customers exporting to the European market.
Following the news of Sientra’s voluntary production suspension, the share price of SIEN crashed to as low as $3.34 by mid-November, from a high of $26.67 reached in late-June.
As a result of the work stoppage, Sientra’s revenue plummeted in Q1, Q2, Q3 of this year to a fraction of the company’s Q3 2015 peak sales performance. But since the stock’s November low, SIEN is coming back steadily following an announcement in early-February 2016 that stated the Brazilian plant is again operating and shipping product.
Previous customers who suspended orders to Sientra are coming back to the company, who, at the height of Q3 2015, supplied between 7% and 12% of all implants to a US market, with estimates ranging from $200 million and $300 million per year of revenue, and growing.
On December 5, 2016, SIEN soared to as high as $10.22 (27.6%), following a news release by the company of an FDA pre-market supplement (PSA) approval for the company’s four new implant styles and shapes. These new products will be added to its present line of nine offerings. The company expects to begin delivery of the four new implant in Q4 2017.
My take: I like the stock for its hidden future trend of higher revenue, as the results of a survey conducted by the company of the customers affected by the work stoppage at the Brazilian plant indicated that nearly all customers expect to order Sientra products again when they become available.
And there is a good reason for this nearly-perfect positive response.
First, Sientra is the only company of the three operating in the US (the other two: Mentor, Natrelle) who offers a two-year guarantee against ‘capsule contracture’, an issue of primary concern of most patients and surgeons. Sientra’s rate of contracture is, indeed, the lowest of the three makers. And the company also hold the distinction of offering implants with the lowest in incidents of rupture.
This is a big deal, as far as I’m concerned. Imagine if you were undergoing an implant procedure. Wouldn’t you want an implant with the highest reputation of product safety? Of course, you would.
Second, patients report that Sientra implants feel more natural, which is definitely another big win for Sientra.
In short, Sientra’s implants are best of breed, which weighed heavily on my decision to engage this stock. I expect revenue to regain the $10 million-plus per-quarter level.
UPDATE: On March 24, Sientra announced it has increased its available working capital by $20 million through an agreement with Silicon Valley Bank. The company stated the capital will be used for general corporate purposes, including preparations for FDA approval of its new manufacturing facility.
Apparently, Sientra wants more control over its operations following the fiasco (not of their making) at its Brazilian plant.
Read Sientra’s Quick Fact Sheet
ABOUT SIENTRA
Sientra, Inc., a medical aesthetics company, develops and sells medical aesthetics products to plastic surgeons and patients in the United States. The company offers a portfolio of silicone gel breast implants for use in breast augmentation and breast reconstruction procedures; and breast tissue expanders. It also provides body contouring and other implants, including gluteal, pectoral, calf, facial, nasal and other reconstructive implants. Sientra, Inc. was incorporated in 2003 and is headquartered in Santa Barbara, California.
Source: Finviz.com
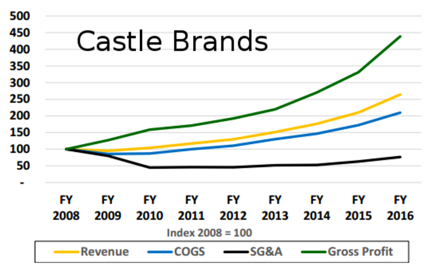
CASTLE BRANDS (ROX)
If you’ve been watching the wire, you’ll already know that ROX is the latest hot small-cap stock on the NYSE, following a February 28 announcement that it had inked a deal with Walmart to supply 4,500 stores with America’s no.1 ginger beer brand, Goslings. As of March 1, Goslings Stormy Ginger Beer and Goslings Stormy Diet Ginger Beer are available on the shelves of approximately 40% of Walmart’s entire chain.
On the day of the announcement, the share price of ROX soared to as high as $1.45, from an opening price of $0.72, a 101.3% spike. The stock has since succumbed to profit-taking, and now trades at $0.99. The 200-week moving average has served as a magnet for the stock, as on the day of the announcement the stock violently traded in a broad range, yet closed at the 200-week moving average. This week, the 200-week moving average was once again a wall for the stock.
Given the comparative market capitalization of the company against its competitors (much larger, too), the stock may easily reach $6 per share, if Wall Street begins to price the stock closer to the company’s industry peers.
Here’s why I like the stock, and expect power moves higher in the future, taking out the overhead resistance at the 200-week moving average at approximately $1.00.
- Revenue growing at CAGR of 20.5% since 2013 and accelerating. In 2016, revenue rose 25.7% in 2016. Gross margin has increased each of the past four years. Operating profits and net income have increased in each of the past four years. Strong balance sheet.
- Consistently grown core brands faster than industry average
- Directors and officers own approximately 41% on a fully-diluted basis
- Shipments of Jefferson’s Bourbon increased 45% to 61,000 cases in fiscal 2016, compared to 42,000 cases in fiscal 2015. § Shipments of Goslings Rums in the U.S. increased 8% to 135,000 cases in fiscal 2016, compared to 125,000 cases in fiscal 2015. § Shipments of Goslings Stormy Ginger Beer increased 56% to 1,115,000 cases in fiscal 2016, compared to 715,000 cases in fiscal 2015. Castle Brands holds an exclusive market agreement for Goslings brands in the United States. Agreement with Walmart for the United States’ no. 1 ginger beer, Goslings Stormy Ginger Beer and Goslings Stormy Diet Ginger Beer, is a monopoly.
- Public drinks companies trade between 5x and 6x revenue and 16x and 20x times EBITDA. ROX trades at only 2.63x revenue. Castle Brand’s closest competitor (by revenue), Remy Cointreau (RCO:FR), trades at approximately 4.28x revenue and 22.7x EBITDA.
Frankly, although this stock has recently gained attention on Wall Street, the stock is grossly depressed at even the $1.50 level.
Earnings won’t come out until mid-May, at which time I expect fireworks. In the meantime, I’ll be watching this stock closely, as I may take a position in ROX at anytime between now and early-May, the latter time of which I expect a ramp up in the stock price as we approach earnings. The company will have one month of sales to Walmart reflected in revenue, so I (and the world) will be able ascertain whether to continue holding the stock (based on assumption I buy the stock into earning) as a long-term play, or not.
ABOUT CASTLE BRANDS (ROX)
Castle Brands Inc. develops, markets, imports, and sells beverage alcohol products in the United States and internationally. Its product categories include rum, whiskey, liqueurs, vodka, tequila, wine, and other spirits, as well as ginger beer and ready-to-drink cocktails. Castle Brands Inc. was incorporated in 2009 and is based in New York, New York.
Until next time…
Trade Wise and Green!
Jason Bond
0 Comments