I’ve heard some say that luck is preparation meeting opportunity.
I agree with that.
Tuesday morning I’d never heard of CRRS before until it came up on the same oversold scan matching the oversold lesson I’ve been using and teaching for years. Here’s how I used my core strategy to make $40,976 on 1 3-day swing trade last week.
Tuesday morning October 1 at 6:49 a.m. EST I said…
“Today is the start of quarter 4, my quarter 3 client satisfaction survey is coming. New quarter, new month so clean slate with a goal of +$10,000 in October. Made +$41,920 in September but that’s behind me, only as good as the next trade. This is how it works, this is what I love, let’s get down to business. The portfolio is +58.66% +$187,533 in 2013 over 3x the S&P 500 +17.90%.”
Here’s what I said about Corporate Resource Services…
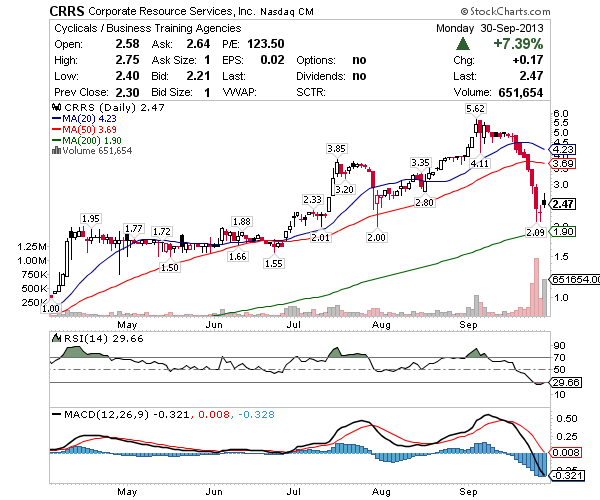
“CRRS – Strong guidance ahead of their November 13 earnings helped slow the bleeding from the recent pullback into oversold. Candle over candle in the continuation pattern and coming out of oversold leaves a ton of range up to the 50 Moving Average for this swing.”
BEFORE
Oversold (Premium content recorded years ago)
Lesson 1: Oversold Chart Pattern
1. A condition in which the price of an underlying asset has fallen sharply, and to a level below which its true value resides. This condition is usually a result of market overreaction or panic selling.
2. A situation in technical analysis where the price of an asset has fallen to such a degree – usually on high volume – that an oscillator has reached a lower bound. This is generally interpreted as a sign that the price of the asset is becoming undervalued and may represent a buying opportunity for investors.
For HD 1. Play 2. Select 1080p 3. Expand
Lesson 1: Oversold Chart Pattern
Here’s how I used the same lesson I’ve been teaching for years to make a boat load of money last week. The real-time BUY alert Tuesday October 1 & real-time SELL alert Thursday October 3. I continued to add size Tuesday and Wednesday as the candles confirmed strength. I scaled out on the way up. Total range was 94% in 3-days and this will happen again.
AFTER
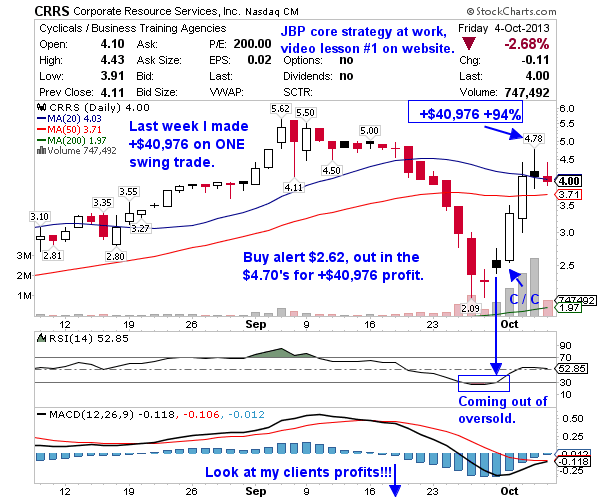
Just 3-days later +93.52% top to bottom. Just 3-days later I locked in my biggest dollar win ever +$40,976. A few years ago when I left teaching in public schools that was just about my annual salary. Add in a +11% +$4,492 move on FNMA and I’m 2/2 in October +$45,468 in the first week. Somebody SMACK me… is this a dream?!
“Hey JB, just sold some CRRS and am up 92% since joining (remember I wrote the email when I was up 13%). Great trading recently!” ~ Asim A.
“Made $11,700 with CRRS, thanks Jason.” ~ Thomas W.
“Holy crap Jason. Out CRRS & FNMA for $10,900 profit in less than 2 full days. You’re my new best friend haha. Thanks man!” ~ Paul S.
“Verified $7,793 profit on CRRS, KILLER! Thanks to Jason Bond Picks.” ~ Jeff L.
“$19,416 realized on RSOL and $7,847 on CRRS. Thanks Jason!!!” ~ Scott S.
You mentioned a while back you got fnma which was 1.50 when you said you bought ,,after that is went down to 1.10 then slowly back to 1.40, so not sure how you made?
Where did I say I bought $1.50 on FNMA? Without going back I believe I said I was looking at it but never said I bought, right? I did buy it on Wednesday and sell it Thursday last week, move was +11% +$4,492 for me. Guessing your not a subscriber right? Last week’s +11% win was my first trade on it in 2013.
Hi Jason,
How often do you run these scans, once a day, twice ??.
I used to run them at night but found predictability is better around 5 a.m. EST after I see what Asia did overnight and what Europe and U.S. futures are doing. I run them again around 2:30 p.m. EST into the close too, many of my late day trades are made that way. Add in Equity Feed and it’s a pretty sure fire way to find winners. Great question Bilal.
Hi Jason,
In relation to Bilal’s question above, what would be a good time in lieu of the 5am scan for traders under the Pacific day time which will be 2AM here? Thanks.
Well the bottom line is the closer you are to the market open the more you can predict. For example had I done a watch list Sunday at 5 p.m. EST I would not have know U.S. futures would be down huge this morning. So if you’re West coast you’d either do it the night before or get up early or even better, let me do it for you and just check your email before the open.
Thanks jason for the post. Can your share some of the tips to be followed by beginner trades to make profit.
Great you might want to place $MERU on your watchlist heavy shorted smelling a major SQUEEZE comming GREAT JOB CHEERS
Great video and post! Jason, how do you know when to get out? How can you know that you are at the top?
So I didn’t know, I sold for 10-20% profits on the way up and bought more as it continued to look strong. The big win is actually a combo of a lot of swing trades versus 1 buy, hold and sell.
Awesome lesson. So well explained. Thank you.