Stocks are pushing lower this morning despite rumors that U.S. – China trade talks are going well. However, does it really matter what’s going on with trade talks… or… if the government has a shutdown…
Nope.
Not if you’re trading penny stocks…
Penny stocks trade on their own island. For example, a company like Apple has dozens of analysts covering its every move. However, penny stocks are overlooked by most financial institutions and get little to no coverage from the street.
That said, they can move up when the overall market is crashing…or… collapse when most stocks are trading higher…
You see, the penny stocks I trade are catalyst-driven. That’s just a fancy way of saying there is fresh news in them. But, I won’t trade the catalyst unless it fits my A+ setup (I trade off of three simple chart patterns). And I won’t take the trade unless my entry has value (favorable risk/reward setup).
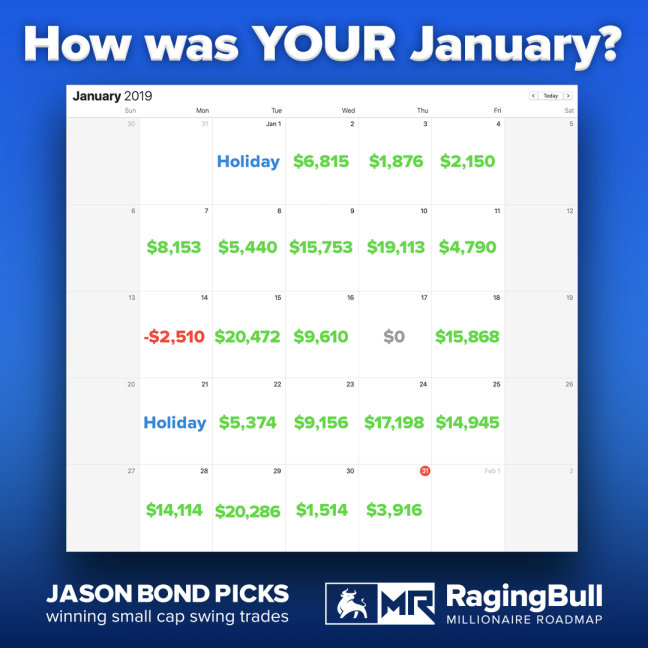
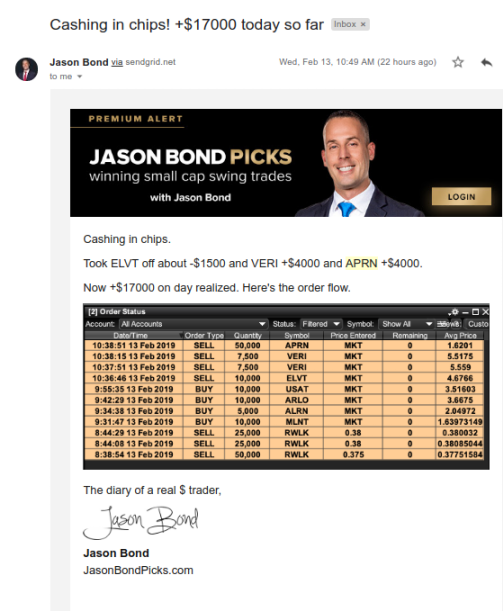
This approach has already doubled my trading account in 2019 ($120K in trading profits). It helped me take down one of yesterday’s hottest stocks (RWLK) and bring in $20,000 in profits from symbols like ARLO, USAT, MNGA, and MLNT.
Now, the average investor has probably never heard of these symbols before. But that’s fine by me… especially when you can drive in results like this:
Now, if you really want to improve as a trader. You must be studying your winning trades. Find out what you’re doing right and ask yourself if there is any way you can do it bigger and better.
A big mistake some traders make is trying to improve their losing strategies. Instead, dump what’s not working and focus on building what is. That said, if you are relatively new to trading, and don’t have a strategy that works or one you trust… I’ll share mine with you.
Chart Patterns Explained – Breakout and Oversold Examples
Repetition is key to beating the markets. You see, I focus on what works for me – patterns, value, and catalysts. That’s where my edge lies. Once you find an edge, you have to press it when you see your bread-and-butter setups.
Now, I was able to lock in $20K+ in just one day recently from my trades.
You’re probably wondering, “What were these trades, and how could I get in on the action?”
Well, check out this watch list that I sent to Millionaire Roadmap clients.
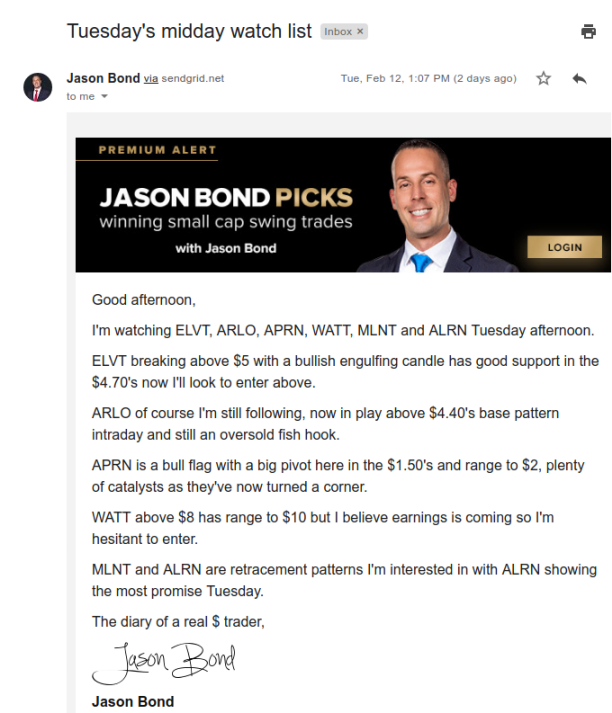
This was a clear game plan for the stocks I had on my radar.
There are two trades I want to highlight here: Blue Apron (APRN) and Arlo Technologies Inc. (ARLO).
APRN Bull Flag (Breakout Pattern)
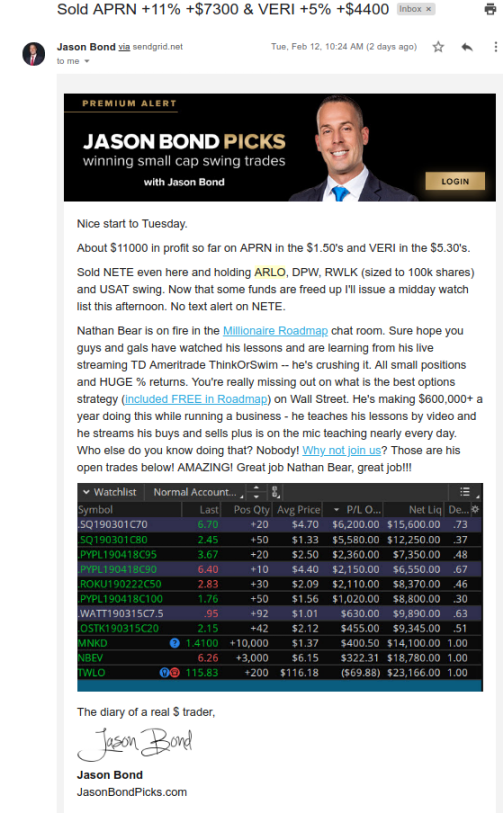
Now, I’ve traded APRN a few times already this year using my patterns.
For example, I already locked in $7,300 profits in APRN early in the morning just the other day…
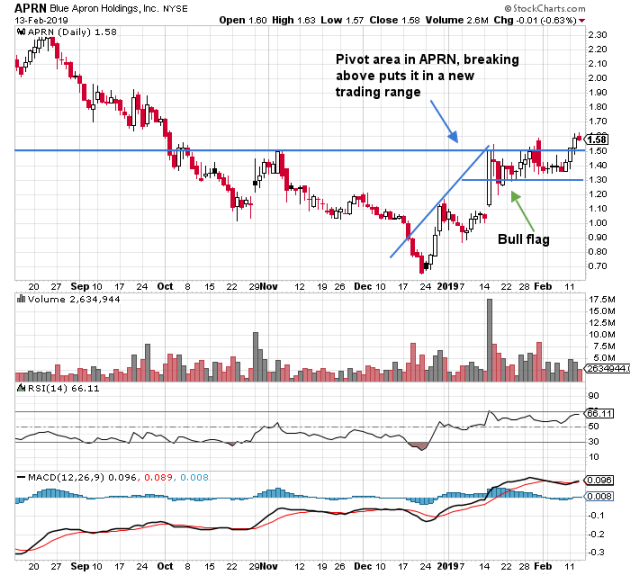
After the lunch rush, I saw my entry and was waiting for my price, which I got. But what was the pattern here? It’s a classic breakout pattern (one of the three patterns I trade) with a pivot at $1.50.
Check out the daily chart on APRN.
I wasn’t looking for much here… just 5-10% in APRN.
Let’s break this pattern down.
- The pivot at $1.50 was a big area of value to watch. You see, this is an area of supply and demand. In other words, the market is at a crossroad. That means if the bulls win the battle, the stock would trade in a new range. On the other hand, if the bears won, APRN would get stuffed and would fall back into its recent range – a failed breakout.
- The stock had a strong runup recently, as shown by the blue uptrend line. Thereafter, APRN traded in a tight range… forming the bull flag. Through my experience, the bull flag breakout pattern is very profitable, if you know what to look for.
Not only that, APRN had a positive catalyst not too long ago, and with this pattern… it might be signaling another potential bullish catalyst.
So what do you do with this knowledge?
Well, I waited for the break above the $1.50 area and held APRN overnight. By the next day, I was locking in $4K in profits.
Moving on, there’s another pattern that might look familiar to you.
ARLO Fish Hook (Oversold Pattern)
Check out the daily chart on Arlo Technologies (ARLO).
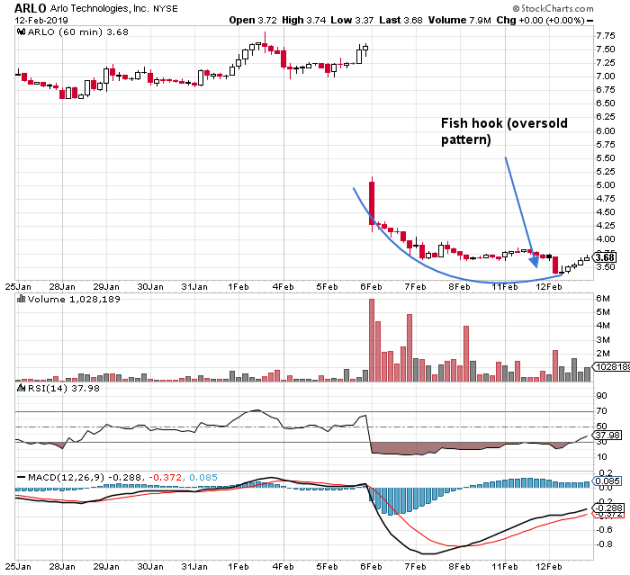
Now, if you look at the chart above, you’ll notice ARLO found a bottom. I bought shares at $3.58. Again, I wasn’t looking for much in this given all the catalysts in the market. I wanted to stay nimble. The stock formed a base around the $3.40s… and went as high as the $3.70s. Moreover, the relative strength index (RSI) was below 30, and broke back above… signaling this stock could catch a bounce.
Well, the stock did catch a bounce and was good for a small gain of $4K for me.
Final Thoughts About These Chart Patterns
“The whole is greater than the sum of its parts”
These gains might not look like much on their own. However, when you add up these gains… your profit and loss (PnL) are well into the green.
When you find a strategy that is scalable and repeatable, you can lock in five-figure gains too. However, the key is to focus on taking profits when you have them, sticking to your plan, knowing chart patterns, and identifying areas of value and catalyst events. Once you have those down to a T, you can start to increase your size, which would increase your profits.
The best part is it becomes easier once you get in a routine. For example, my trading has improved so much simply by focusing on my specific setups. If you want to know more about them in greater detail, here’s how you can get started.
0 Comments