Wow, what a wild market it’s been…
Yesterday, stocks experienced the worst selloff since March… and early this morning, stocks were ripping higher.
It’s quite clear to me, that the “buy the dippers” are back in action…
And they may be here to stay.
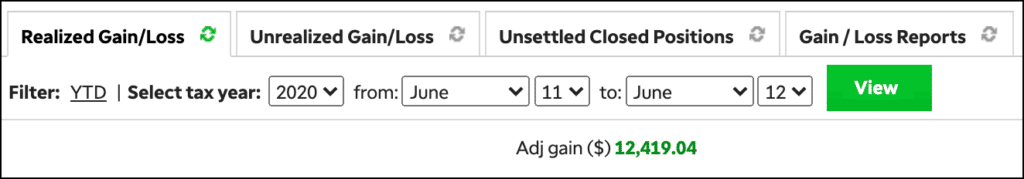
Despite all this market volatility, I was able to navigate through all this momentum and rattle off more than $12K in gains.
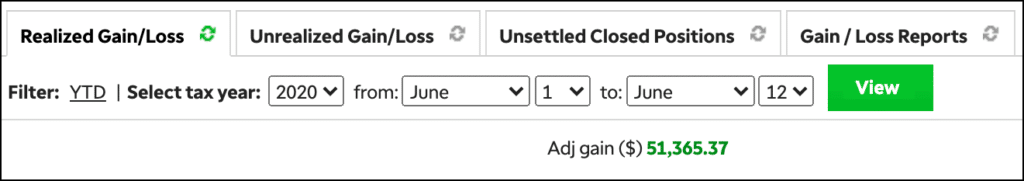
So far in June, I’ve realized more than $50K in gains…
And of course, many of my subscribers have been wondering how I was able to time the market.
Of course, for me personally…
I thought it was pretty simple because I literally just looked at one horizontal line.
Today, I want to reveal to you how I was able to time the pullback in the market to near perfection, in my opinion… and my plans for this volatile environment.
[Revealed] How I Timed The Drop In IWM
Of course, everyone wants to time the market… and know when the pullbacks and pops will occur.
The thing is… with so much information out there, it’s so easy to get wamboozled by the market.
I mean there are so many headlines coming out every day… how can one possibly know which catalyst will move the market?
For me personally, I’ve just been focused on my edge: charts.
On Monday, I mentioned to my subscribers that the market could stall very soon.
More specifically, I was looking at the iShares Russell 2000 ETF (IWM).
Basically, I noticed a key resistance level right around the $153 – $154 level.
This area was pretty important because IWM actually tried to break above it back in March, after the large pullback in large February.
However, it failed…
And that caused me to realize that was a key area where IWM would likely stall.
The thing is, I’m able to turn whatever I see in the charts to actionable trade ideas.
For example, here’s what I sent out to subscribers on Monday… when I thought the market would stall.
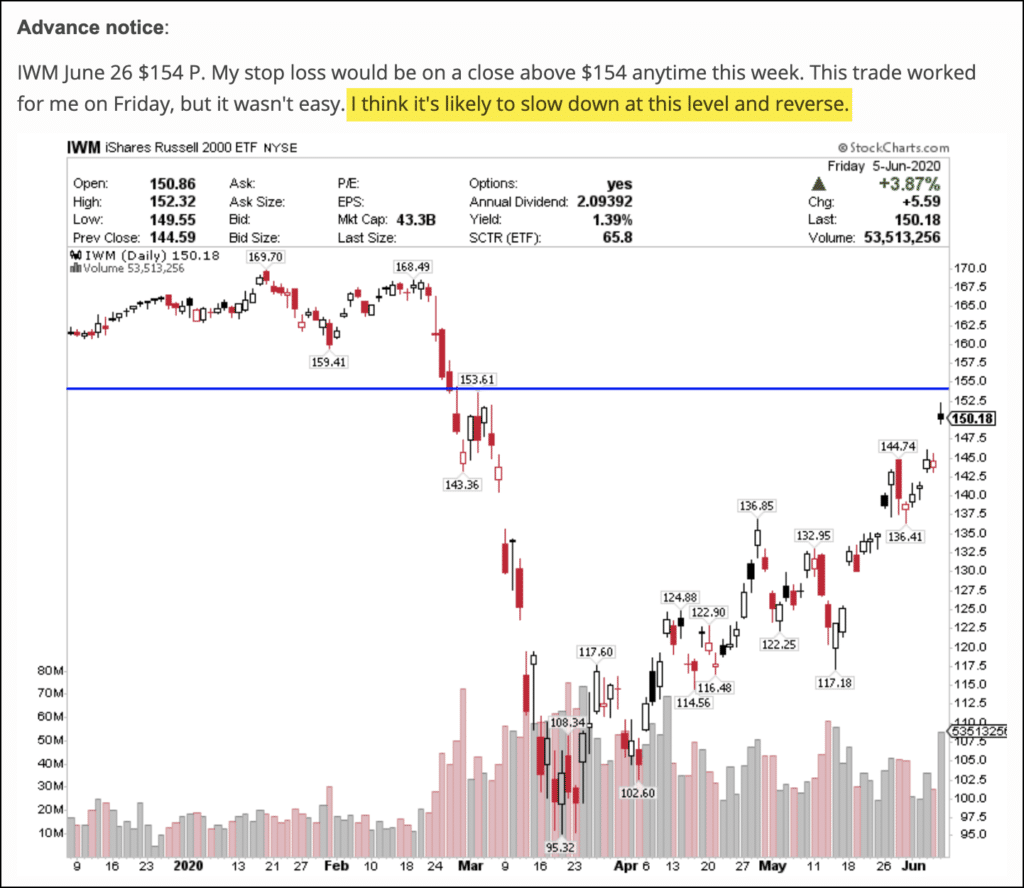
Chart Courtesy of StockCharts
I mean if you look at the chart above, IWM was pretty much in no man’s land at the time… and I figured if it got close to the blue horizontal line…
Traders and investors who were already long would look to sell their holdings… and short sellers may look to pile in.
When I noticed this happen in IWM, I actually got pretty cautious with my trading and shifted from bullish to bearish bets… and it paid off.
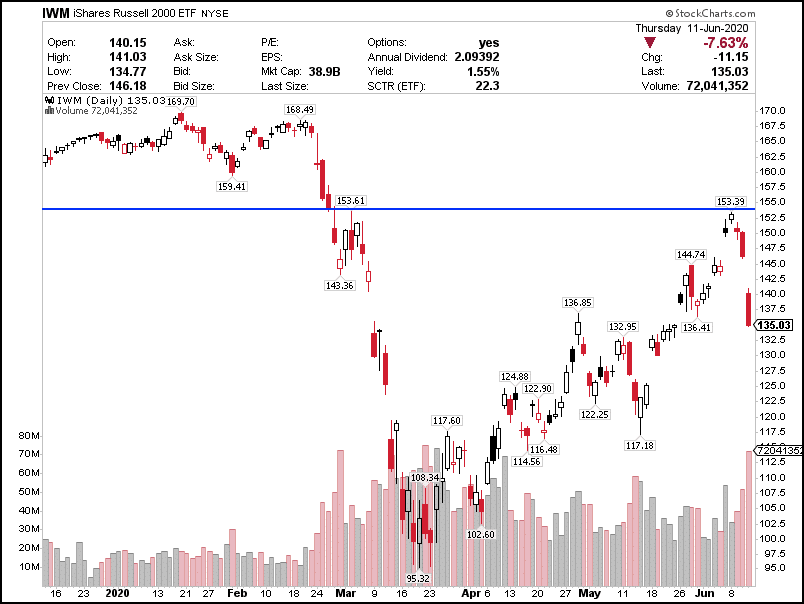
Chart Courtesy of StockCharts
I mean just look at what happened with IWM… it tried to get above that blue horizontal line… and failed again.
Then it suffered a massive pullback.
Right now, I’m going to remain cautious due to all the volatility because it’s very easy to get caught up.
However, I will look at the charts to try to identify key levels to keep an eye on.
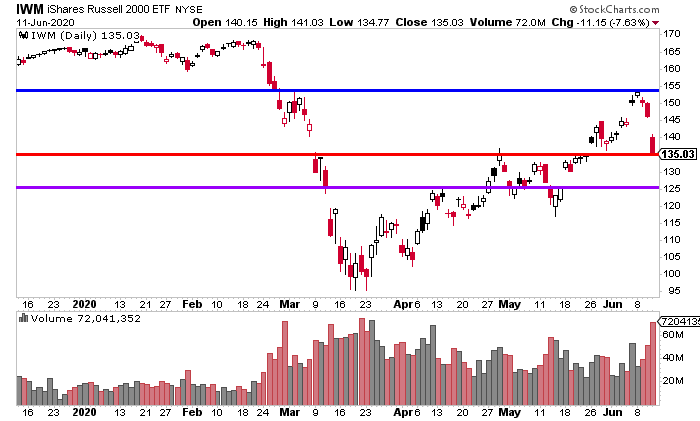
Chart Courtesy of StockCharts
There are 3 key levels I’m focused on right now, the red horizontal line is another inflection point…
If IWM breaks below that, I think it can quickly break below $130 (a key psychological level)…
And thereafter, the next line of defense, in my opinion, is at $125.
I’m going to continue to monitor all the macros and charts to plan my momentum trading accordingly.
Now, if you want to learn how I’m able to use chart patterns to my advantage and uncover momentum trading opportunities…
Then you’ll want to check out this important training workshop.
In this workshop, I detail my number 1 edge and how I’m able to trade part-time.
0 Comments