With so much action in the market — specifically in the momentum stock space, I believe there’s one question on some traders’ minds right now…
How do you filter for momentum stocks to trade?
You see, on any given day, I notice dozens — sometimes hundreds of momentum stocks poised to run… but I think it’s nearly impossible to trade them all.
That’s why I came up with techniques to scan and filter for momentum stocks to trade… and today, I want to reveal that to you.
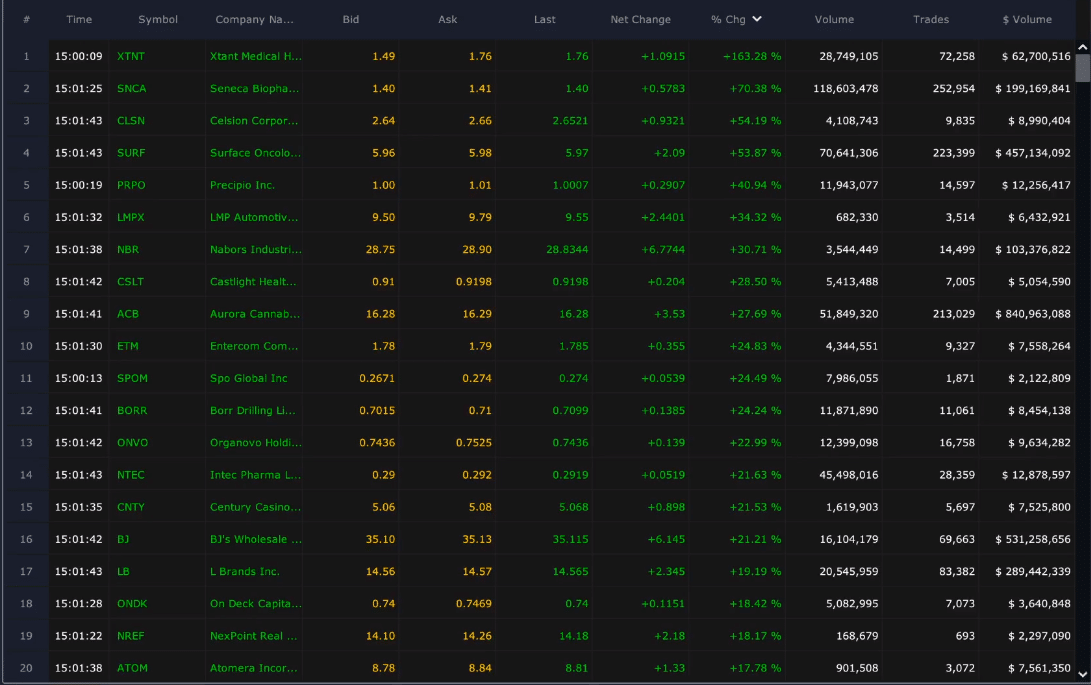
Source: Scanz Technologies
I mean just take a look at the screenshot above of some momentum stocks that were moving yesterday… how could one possibly narrow down those to just a handful?
[Revealed] My Technique To Find Momentum Stocks Set To Run
With so many stocks out there to potentially trade, traders often get caught up in all the noise. Heck, when stocks are flashing green and red, how can anyone actually be efficient and effective trading these names?
I don’t think it’s possible, unless you have an algorithm or something.
That’s why I use a scanner to let me know what’s moving on any given day. However, I’m not just looking for stocks that are gaining on the day… that would just be foolish.
For me personally, I don’t just want to trade stocks that are moving, I want to find liquid momentum stocks.
What do I mean by that?
Well, before the opening bell, I look to my scanner and only look for stocks trading under $30 (typically) with a dollar volume of at least $200K. I believe the dollar volume provides me a better view of liquidity, in relation to share volume.
Now, after the opening bell, I filter for stocks under $30 with a dollar volume of at least $2M. As I filter through these stocks, I actually sort by % gainers to see what’s moving. Sometimes, I may sort by % losers too… if I want to play potential bounces.
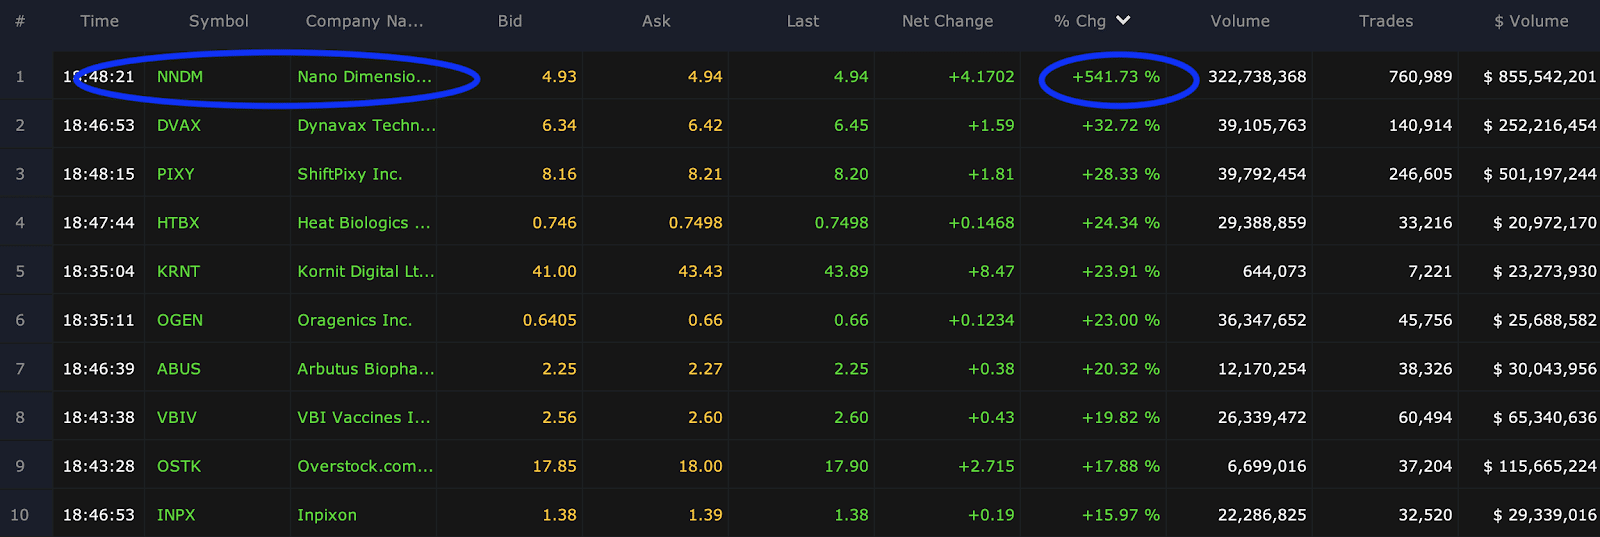
Source: Scanz Technologies
For example, the other day I spotted NNDM moving… and if you notice, the dollar volume ($ volume) was more than $855M. That let me know this stock could have legs.
By following that process, I was able to spot NNDM and another 100% move in the stock.
Why did I think NNDM could run higher after being up more than 500%?
Well, there was a catalyst… and my chart pattern popped up.
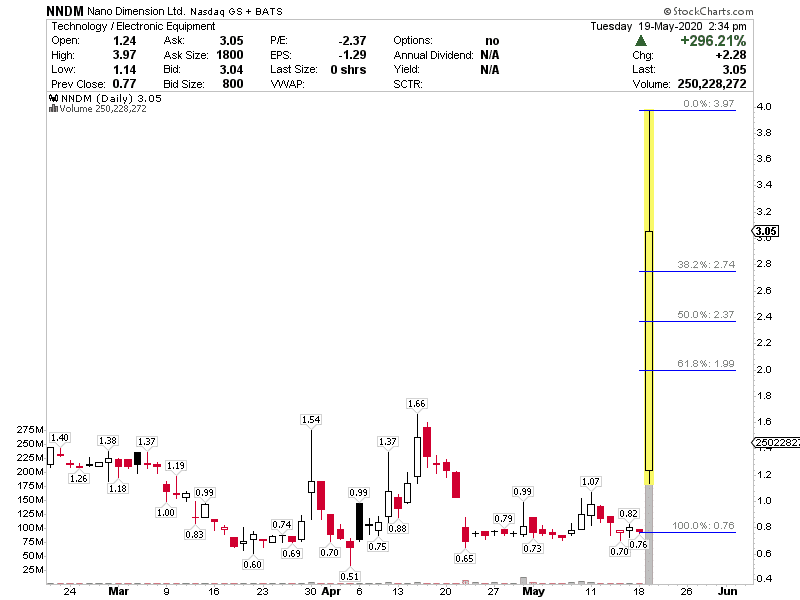
Source: StockCharts
Basically, I noticed the Fibonacci retracement in NNDM, and there were areas of value in the stock, in my opinion.
So I quickly came up with a trading plan and sent out NNMD in an advanced notice alert.
Now, NNDM didn’t dip a whole lot and I actually had to wait for the right time to get in. I actually bought shares at $3.21 and intended to hold the stock overnight for a potential gap up…
But guess what happened in the afterhours the other night…
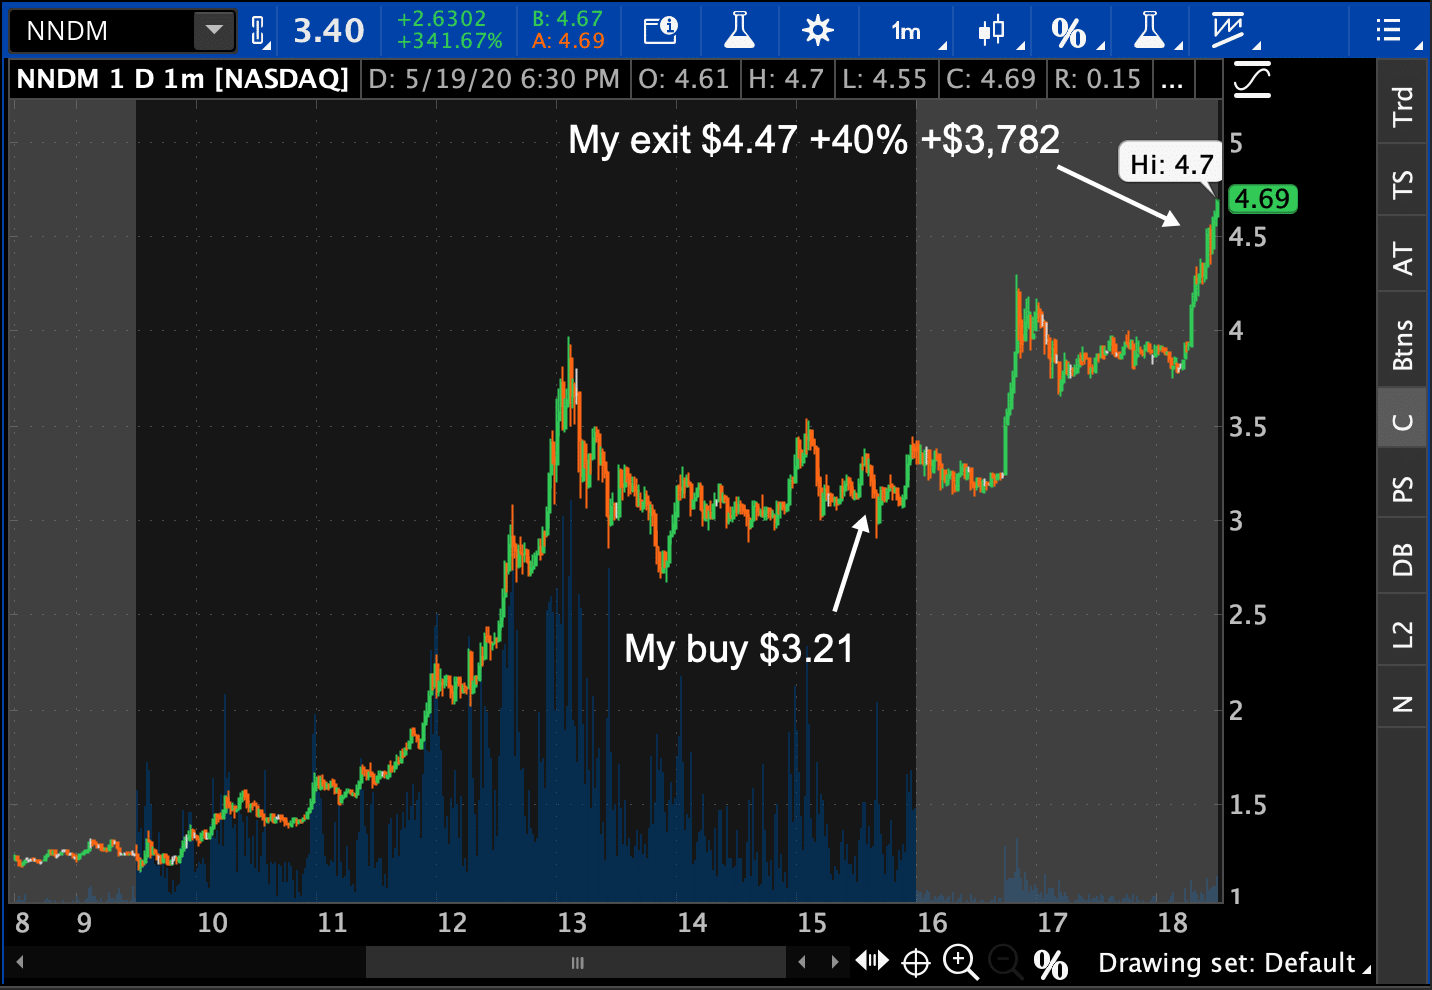
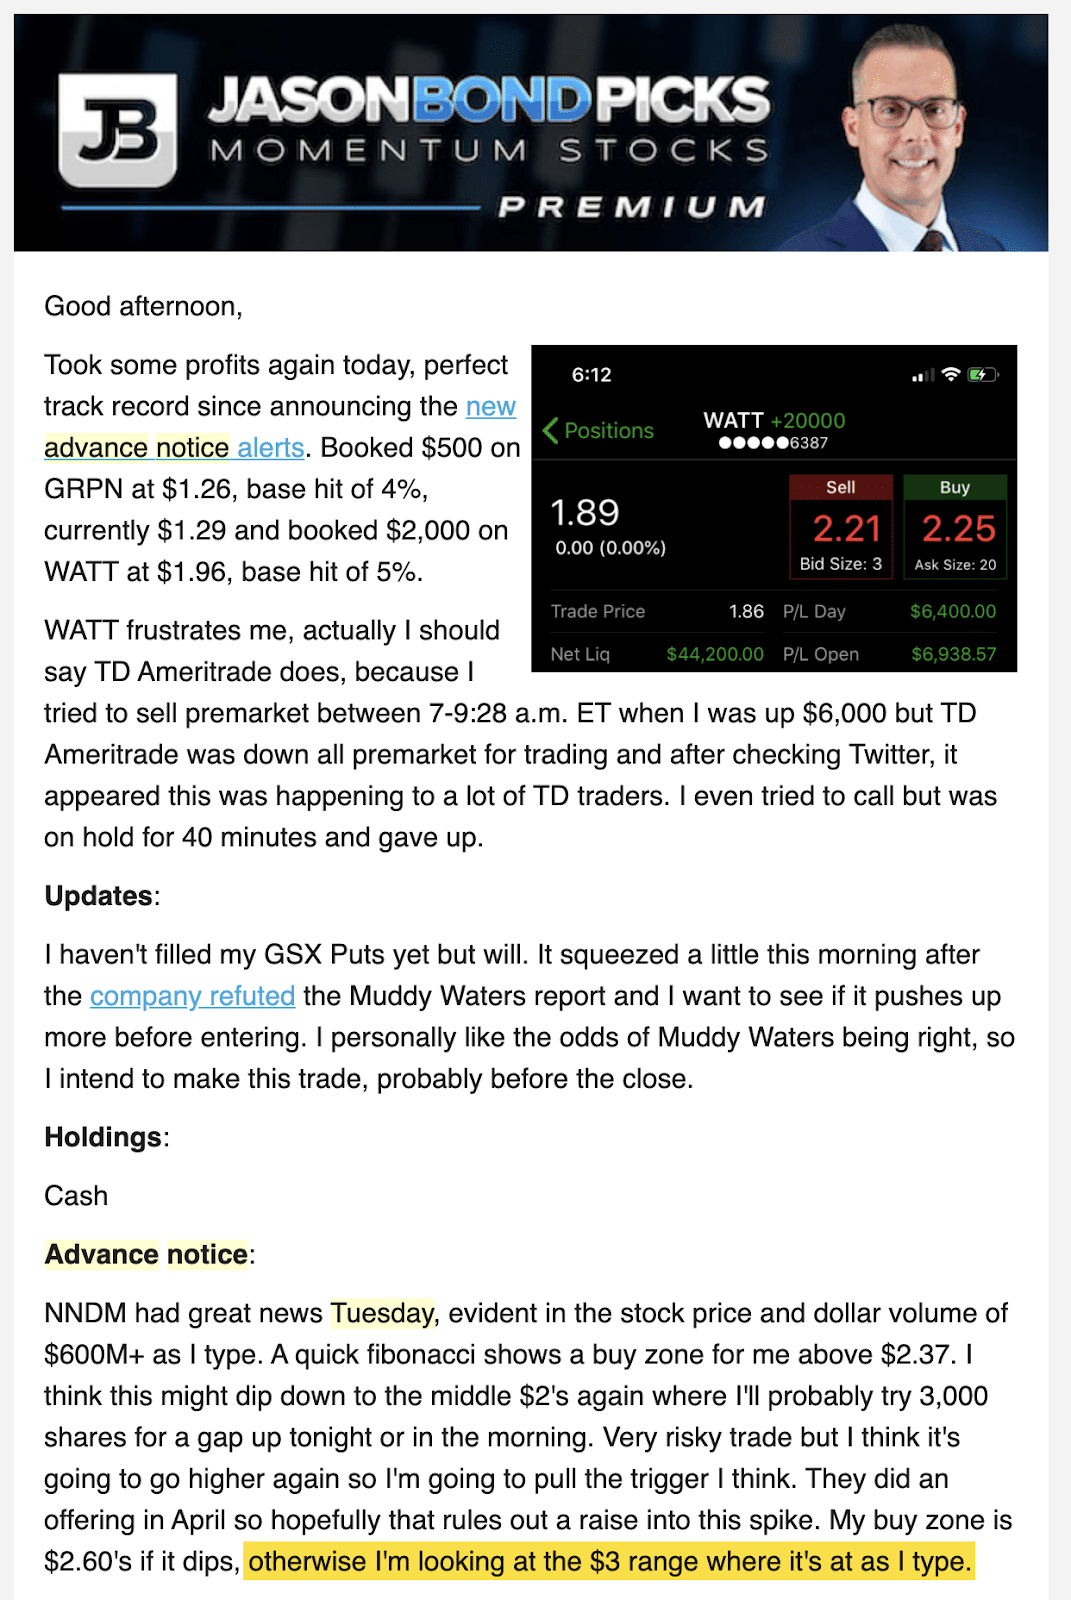
Source: thinkorswim
Of course, I was a little mad because the stock actually ran all the way up above $6!
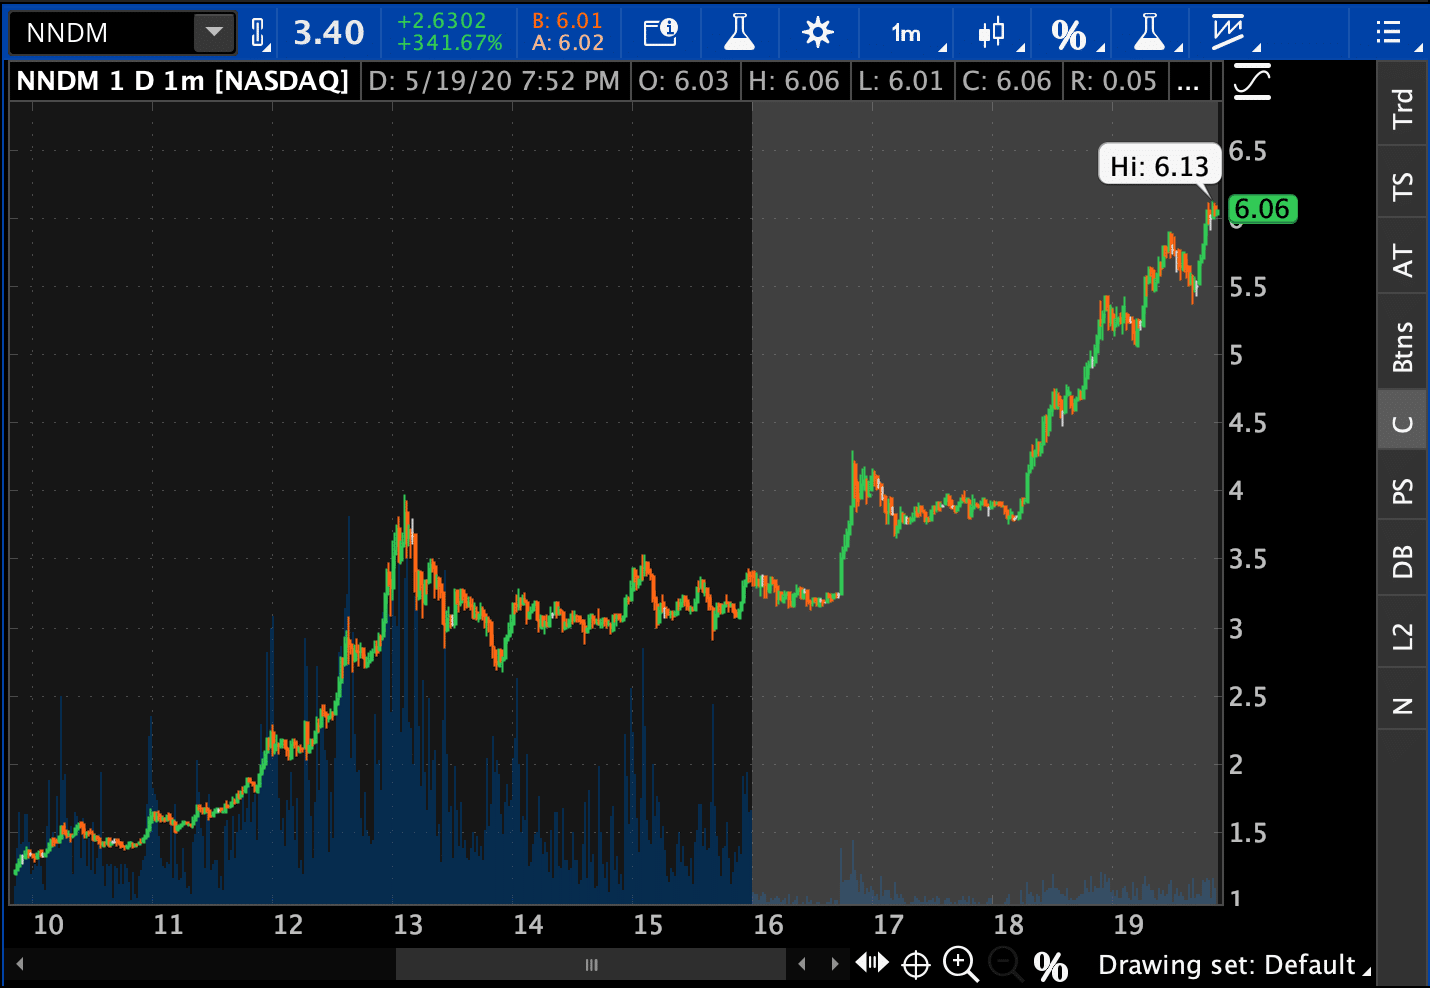
Source: thinkorswim
I was only mad for a few hours because I actually exceeded my typical profit target of 10-20%.
Instead of moping around… I just went back to the grind and looked for other potential plays from my scanner.
Now, if you want to learn how I use my scanner to hunt down momentum stock plays and how I use my patterns, then click here to attend this special training session that I put together.
0 Comments