Made another $1,000 Monday closing ZNGA and $2,300 total on GLUU bringing April’s profit to $16,970 and 2013 profit to $94,284. The portfolio is up 30% in 2013 and with one day left in April I’m starting to think about my goal for May which is $10,000. I’m about 90% cash heading into the last day in April 2013, here’s the portfolio and open trade analysis.
The major indices advanced Monday after economic data showed consumer spending and pending home sales were up, despite personal income coming in lower than expected. Into Tuesday the economic calendar continues to heat up with employment cost index at 8:30 a.m. EST followed by the Case-Schiller home price index, Chicago PMI and consumer confidence index.
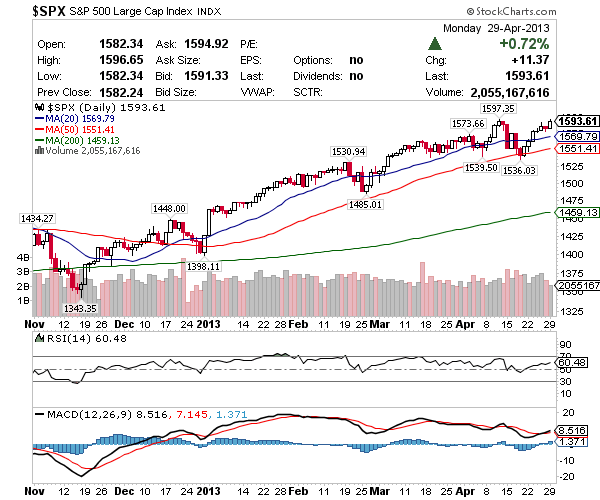
Technically the S&P 500 closed just below all time highs applying more pain to shorts as the recent rally gained more momentum. Tuesday’s data, if strong, could drive the S&P 500 above 1600 triggering a major breakout in the major indices. Adding fuel to the fire, it’s not even close to overbought and there’s no sign of QE3 slowing anytime soon.
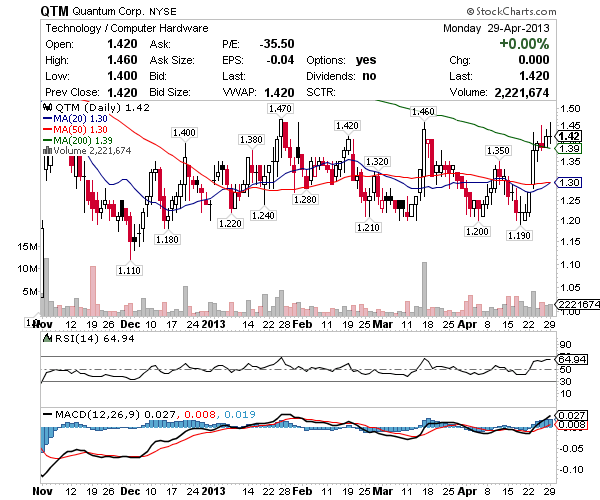
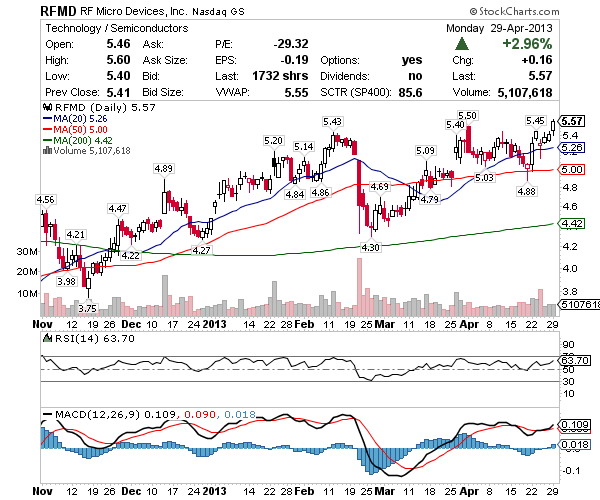
Given the major indices could breakout Tuesday I might look to work a breakout i.e. video lesson 3. If the market is weak Tuesday though, breakouts are far and few between so all bets are off if it’s at horizontal resistance. Most of the time I’m accumulating video lesson 1 (oversold) and selling into video lesson 2 (continuation) but Tuesday I might buy video lesson 3 which is a continuation patterns pending a breakouts. Keep in mind breakouts often squeeze which can add a burst to the trade and deliver gains quicker than accumulation trades. All ascending triangles with 3 out of 5 (GTAT, QTM, RFMD) pending breakout territory.
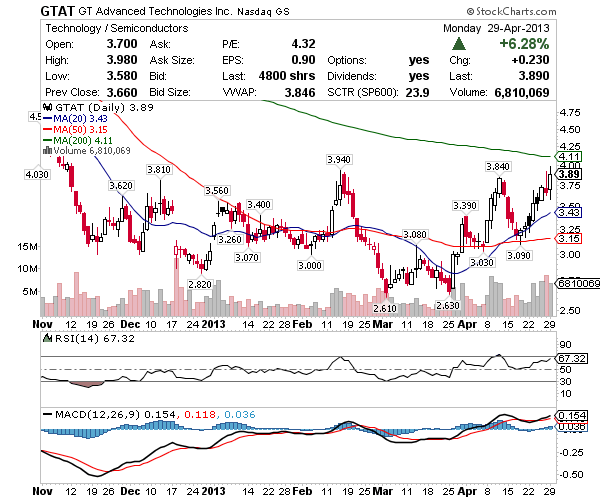
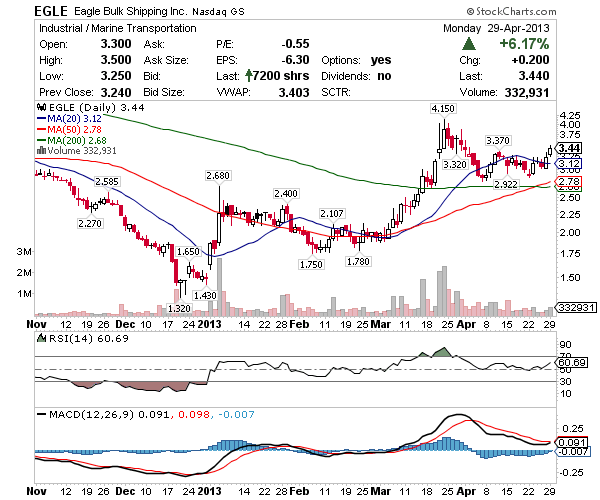
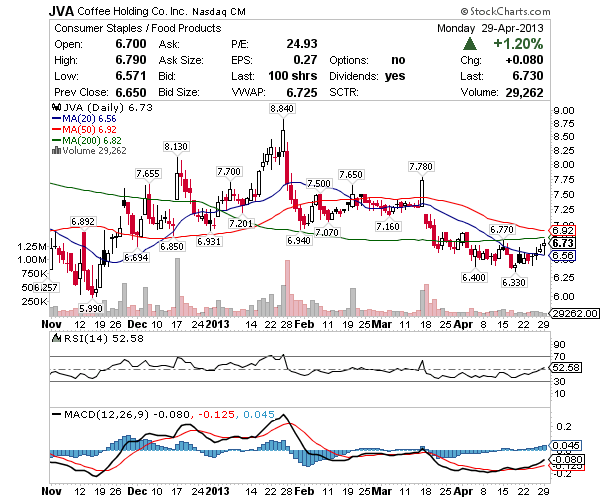
These charts include trendlines so it’s a great way to reference the ascending triangles, by far my favorite continuation pattern. Notice how EGLE and JVA are just coming off support while GTAT, QTM and RFMD are pending the breakout. Huge difference in how they hold up during a run and understanding that can be the difference between profit and loss so please be sure to watch video lesson 2 and video lesson 3 if new.
GTAT – Nice breakout pending chart into Tuesday with some resistance below $4 and the 200 Moving Average at $4.11 at which point it’s clear blue sky to $4.50’s. With an RSI of 67 it’d be in and out time on GTAT because the 1-year chart shows it doesn’t hold overbought status for long. Having said that, this setup could lead to a multi-day breakout but I’d definitely be watching it close along the way for signs of profit taking.
EGLE – Off $3 support and out of the recent wedge a move to $4 is what I’m looking for here. This is straight from my video lessons and while buying $3 would have been ideal, the topside action above $3.37 Monday means it could be gearing for a bigger move.
JVA – Light volume but definitely in play above $6.50 and on the curl. Looking for chop at $7 but even with that I think $7.30’s is reasonable if volume accompanies a move through the 200 Moving Average. I’d like to see some volume before making a move here, it’s just too thin of late but this curl should attract others as well, so we’ll see.
QTM – Accumulation above the 200 Moving Average this is a perfect example of what I call chop -n- pop! Notice how it’s slowly walking higher just under a common area of resistance in the upper $1.40’s? If volume builds and $1.47 falls it could run to the $1.70’s which would be a big win for a $1 stock.
RFMD – Into breakout territory Monday, the $5.50 break was key, if the major indices advance Tuesday this could open up on the way to $6. I’m thinking $5.40 should act as support for the breakout to go, otherwise I’ll put it in the parking lot for trendline accumulation around $5.20.
What do you think about CLF and TTI ?
Those are two names I’m not familiar with. I’m an under $10 newsletter. Tetra fits there but it’s not one I swing regularly.
Thanks, Compared to some of the other services you seem to process the chart information
better with better results. What % of your trading capital do you like to apply to any of your
postitions ?
Regards,
Mark P.
I like 10% on most trades and up to 30% on some depending. Cheers, J.
Do you have any rules of thumb about how much cash to have at any given point? Do you have a strict set of rules you follow aside from that or do you go by “feel”.
I’m never fully vested that’s for sure but no % rule of how much cash to have laying around. Yes I have a strict set of rules I follow to swing trade, that’s for sure. They are all on the site. Cheers, J.