No matter what type of trader you are the following three rules have shown to put money in your pocket (or save you from significant losses) more times than not. Be warned, however, that sticking with these rules is easier said than is done. Discipline is the key!
(My members at Jason Bond Picks always get my insights and actual trades in near REAL-TIME. It is the best community you will find for learning how to become a better trader.)
Many times in the heat of battle, an undisciplined trader panics and throws away his training, oftentimes with catastrophic results. On paper, the following set-ups appear quite simple to execute; but when real money and pride are on the line, a once-simple trade suddenly becomes a difficult one to actually execute.
And of course, the 3 rules presented here (two buy-side and one sell-side) represent only a tiny sample of the hundreds of back-tested trading techniques available today. But, these three rules of trading are the most easily understood and executed trades for the novice and intermediate trader.
Buy Rule: Buy at previous support and resistance during a sell-off which followed an extended rally.
 By extended, we mean several to many months of trending bullish price action. The chart, below, of Stepan Company (ticker: SCL), a manufacturer of specialty chemicals, demonstrates the stock’s price action and price level at which to buy, according to the rule.
After the sustained rally from the price breakout in December 2011, SCL moved higher for more than two years before selling pressure knocked the stock into what turned out to be a significant correction. As prices were falling below the 50-day moving average, traders had begun to speculate about the price level at which significant buying pressure would again favor the bulls.
Did the bulls take charge again in May/June 2014 at $50 support (shaded blue area)? How about the 200-day moving average at $47.50 in September 2014? At each juncture, traders gambled on a bottom.
Of course, we now know that it wasn’t until late November 2014–at the $35 level–when the bulls took back control of SCL.
So, how do we prevent from falling victim to the false bottoms at $50 and $47.50? The straight answer is: We don’t now. But what we do know is, that each trade has an implied risk/reward proposition attached to it. And if traders took the time to calculate the amount of downside risk wagered to achieve an upside reward, the seasoned trader would have sought greener pastures of another stock, or would have waited for better prices to enter the SCL trade. In the case of the latter, here’s what we mean:
The implied risk/reward ratio formula is: (implied high – price paid)/(price paid – implied low), where SCL’s “implied high” = $65, and “implied low” = $30 (see chart, above).
So, plugging in the numbers to calculate the risk/reward ratio for the SCL trade, we result with:
If traders bought SCL at $50, the implied risk/reward ratio calculates to ($65-$50)/($50-$30), or $15/$20, or 0.75.
If SCL was bought at $47.50, the risk/reward ratio would change only slightly to ($65 – $47.50)/($47.5 – $30), or $17.50/$17.50), or 1.00.
For those traders who were patient during the correction had the opportunity to buy SCL at near $35, which is a price level of significant support (previously resistance in 2011). At $35, the implied risk/reward ratio calculates to ($65 – $35)/($35 – $30), or ($30/$5), or 6.00—a six-fold increase to the ratio. In other words, theoretically, for each dollar risked $6 may be made. And as it turned out, traders buying at the $35 did make a profit of $20, a 57% return on investment within eight months.
Sell Rule: Sell when the stock price closes below its 200-day moving average after the second instance.
How do we mean? Let’s look at an example: Steven Madden, Limited (ticker: SHOO), a maker of clothing lines for men, women and children.
This is one of the most important rules we follow at JasonBondPicks.com. When a stock falls below the 200 day moving average for more than a couple of day — get out and ask questions later! Of course, if you ever have any questions that I can help with please feel free to email me directly: jason@jasonbondpicks.com.
Look at the chart of SHOO for the six-month period ended Nov. 13, below. As the stock proceeded to fall into a bear market in July, the stock tested and failed support at the 50-day moving average, subsequently trading between the 50-day and 200-day moving averages for approximately six weeks. After failing to trade above the 50-day moving average for more than a week in September, the first violation of the 200-day moving average took place in late October. SHO tried to trade above the 200-day moving average during the first days of October, but fell back below the 200-day moving average again in within two weeks. In the above instance, the rule is to sell at the close of the second day of a 200-day moving average violation, which took place on Oct. 13.
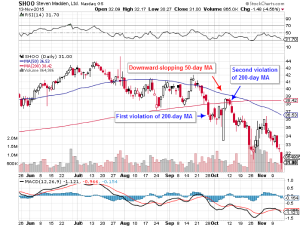 In the case of SHOO, those who followed this sell rule were either stopped out of a significant deterioration of the stock’s price, or made money by selling the stock short. Those who did sell SHOO short generated a profit of 17.3% within five weeks of trading, which calculates to a 180% simple annual rate of return.
Please note, as a corollary to this sell rule: For best results, statistically-speaking, the 50-day moving average must slope significantly more than the 200-day moving average. In other words, the stock must be in a downward trend for enough time for the 50-day to be slopping downward (as in the above example). In the SHOO example, the stock didn’t attract enough buyers to maintain the bull market. Capitulation came when the stock couldn’t hold its 200-day moving average for the second time despite bargain-seeking buyers come in to buy following the first violation.
Buy Rule: Buy after massive plunge and oversold RSI reading (RSI<30)
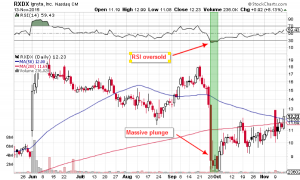 To illustrate this buy rule, let’s use the chart of Ignyta, Inc. (ticker: RXDX), a precision oncology biotechnology company.
The chart of RXDX, above, shows the effects of trader panic on September 28, following the company’s disappointing FDA Phase I interim data for its cancer drug FDA candidate, entrectinib. On that day, shocked shareholders sold feverishly until the stock’s market capitalization was cut to more than half. The subsequent four days of consolidation above the $8 level presented a good opportunity to enter a buy order for the stock, as volatile trading usually indicates a turning point in the trade. In addition, note from the chart, below, support for RXDX was also indicated at $8.
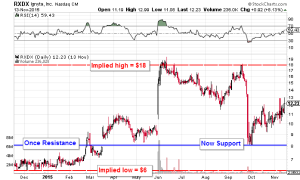 The six-week rally that followed returned as much as 62% on an original stake at approximately $8. The implied risk/reward ratio for the trade calculates approximately to ($18 – $8)/($8 – $6), or $10/$2, or 5. For each implied dollar risked, an implied $5 may be made—a good bet.
Final Thoughts
While the trading rules presented in this article are by no mean foolproof, they do serve as a guideline to novice and intermediate traders. These three trading rules work for traders much more than they do not work. Therefore, stop-loss orders are always encouraged, as decision beforehand of the amount of risk you are willing to take will have not been made during the emotional stress that comes with price volatility.
0 Comments