Good morning,
Back in July, I initially bought 50,000 shares of ROX. Then, in late-September, I bought an additional 15,000 shares, and have since purchased another 15,000 shares, bringing my total to 80,000 shares, an amount I still hold today.
The earnings report for Castle Brands, released on Feb. 8, showed earnings-per-share in line with estimates and a revenue beat of approximately $3.4 million. Nice. The stock responded with a move of as much as $0.15 higher, a 13.3% spike, but as of Tuesday, has since fallen to $1.17, for a modest post-earnings trade of a 3% gain.
Now that Q3 earnings are out of the way which resulted in another quarter of good progress, I’m issuing an update to ROX, because those of you who’ve followed me into the trade as early as this summer must be scratching your heads about this stock’s performance. Let me present the crux of my recent work about ROX, and maybe you’ll be able to see a bigger picture emerging for when the company reports in early May its full-year 10-K. That’s the time when I believe this stock will more than make up for its puzzling lag to the overall S&P 500, especially when the valuation metrics of ROX are so modest when compared with the S&P 500’s.
Yup, ROX is a lesson for all of us about what many of the great fund managers have talked of when a good stock doesn’t reflect its underlying value. The great Benjamin Graham, Peter Lynch of the Fidelity’s Magellan Fund and, of course, Warren Buffett of Berkshire Hathaway have all said to learn patience during times when the market is looking the other way.
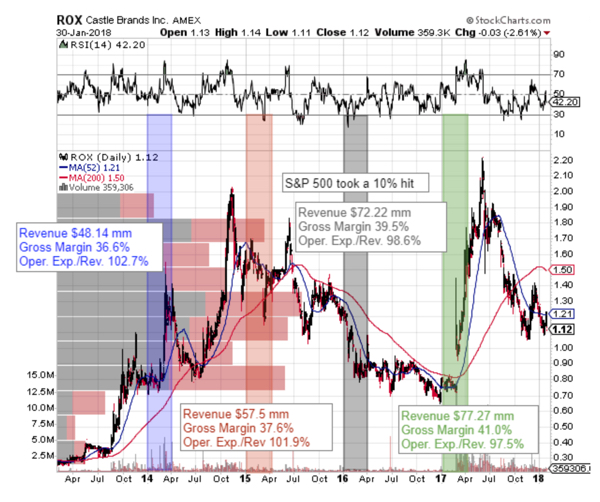
So, what am I talking about? Let’s look at the past four-plus years of the financial performance of Castle Brands, and you’ll then see the details of the overall picture I’m about to paint. Look at the chart of ROX, below. It’s busy-looking, so don’t become overwhelmed. I’m going to step you through it.

As indicated by StockChart’s volume-by-price feature (the horizontal gray and red bars of the left-hand side of the chart), ROX trades at approximately its equilibrium price, where most of the trading has taken place. Support should be very strong in the low $1’s.
And again, from the chart’s volume-by-price, the next active price range is $1.68 and $1.82, where I might consider unwinding the trade for a 20% profit, though waiting to get a glance at the company’s 10-K in early-May might tempt me into speculating a profit to a near-double of today’s price of ROX. For new, I’ll cross that bridge when I get to it.
The vertical bars (blue, red, gray and green) mark the price action of ROX during the company’s fiscal fourth quarter (first quarter of calendar year, similar to retailers’ fiscal year-end). These four time periods (as shown in the chart) are the times when ROX begins to heat up. You might say, traders get ‘jacked up’ for the fiscal year-end report.
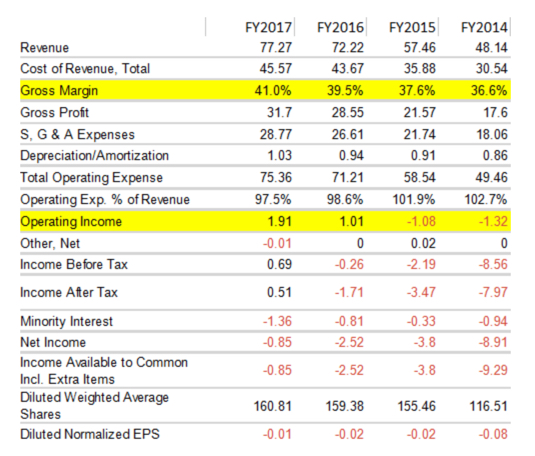
Okay, starting with the fiscal year ended 3/31/2014 (blue vertical bar), we can see that Castle Brands reported $48.14 million of revenue; a 36.6% gross margin; and operating expenses of 102.7% of revenue. The next bar (red) shows an improvement of all three financial metrics (revenue, gross margin and operating expenses). The gray bar, better. The green bar, better still. So, in the fiscal year ended 03/31/2017, Castle Brands increased revenue by 60.5% to $77.27 million.
By 2017, gross profit increased to 41%, from 36.6%, with incremental improvements during each successive fiscal years.
Operating expense improved to 97.5% by 2017, from 102.7% in 2014. Again, each fiscal year showed incremental improvement from the prior year.

But notice the level of the stock price (first chart). Sure, the company has increased its number of outstanding shares (second chart, near the bottom), but the bang for the buck has been worth the dilution, which is the point of a successful capital raise. Outstanding shares rose to 160.81 million at the close of the year ended 03/31/2017, from 116.51 million in 2014—a 38% rise. But revenue during the same time period rose 60.5%, while gross margin and operating expenses (as a percentage of revenue) markedly improved.
And if we put it all together, net income has soared! For the year ended 03/31/2104, Castle Brands lost $9.29 million. By 03/31/2017, the company lost 850k. And during the current fiscal year, Castle Brands is profitable.
So, the bottom line is: management has been pretty good, a B+, or an A-, in my book.
So, back to the level of the stock. With these good tidings, ROX now trades at approximately 85% of its average stock price of Q1 2015 (calendar year).
Earning in the past five years has grown by 37.40% (CAGR). This year’s earnings is projected to reach 66.4%. And next year, Castle Brands (as well as analysts) expect a double—100%! And the stock trades at a 15% depressed valuation from Q1 2015?!
So what gives?
ROX is a seasonal stock. Look back at the chart and notice the ramp in the stock price as we head into the company’s release of its 10-K in early May. Aside from calendar Q1, a time when the S&P 500 dropped 10%—taking ROX with the overall market selloff—that is the time period when the stock makes its biggest moves. Each year, aside from calendar year 2016, the stock price highs have been higher than the highs of the previous cycles.
With approximately $100 million of revenue expected for fiscal 2017 (reported in May 2018), a slight improvement to gross profit and operating expenses expected, net income might spike again. That’s my expectation. So, we might be looking at a $3.00 stock at its peak in late April, or early May through June.
And analyst agree with my rosy assessment, though not the approximate price level of ROX by June. Analysts are notoriously stingy with price predictions, because it’s so easy to make the target when a lowball estimate is published. Right? Anyway, the mean analyst estimate is a “strong buy” at this level, $1.12, with a target price of $2.00.
So, all of my readers who’ve been holding ROX since late summer, hang tight. You might be rewarded quite well for sticking it out through to the best part of this stock’s cycle—which brings me back to Graham, Lynch and Buffett. When you buy value, the price eventually comes, irrespective of how neglectful traders had been. Traders finally catch up with the stock. I believe ROX is one of those stocks. It trades at paltry two-times revenue, and has an earnings growth profile of a 100% by this time next year? Therefore, ‘I am in’ for the best part of the haul coming up. Hang tight, guys and gals.
The diary of a real $ trader,
Jason Bond

The 10K won’t be out until June.
There was no run up into this quarters earnings as what was suggested would happen in this write up. Also, ROX came out with earnings after the bell tonight and it sold off about 7% from 1.27ish to 1.18. I know your article uses the qualifier may be 3.00 in April thru June….but sadly….we are no where close to that number. Article was suggesting 100 Mill…actual was 89 million. Sorry to say, It seems the research team for this article got it wrong.
Looking back in retrospect and comparing the analysis of this article to the actual earning results that ROX released tonight, not much, if anything in this article came to fruition. Most notably annual revs calling for $100,000 mill versus actual of $89 Mill, possible $3.00 pt vs actual pt of 1.27 and the calling of a cyclical run up into this earnings which never happened. Thoughts? Thank you in advance.
Hi Dan. ROX is one of the best real penny stocks out there. I’m sticking with it. I’ll dig into earnings / outlook this weekend and provide and update sometime next week. As far as being perfect at predicting long-term events it’s simply not possible But I’ve been pretty accurate in the past when shares went from $1 – $2 and believe it will happen again. This is why I do less long-term trades, it’s very hard to predict exactly when. Anyway, I love the stock and am sticking with it. How much do you have at what price,
Any updates Jason?