Well, it’s a holiday-shortened week — but that doesn’t mean I’ll be taking it easy…
I’ll still be on the offensive and look for my favorite chart setups.
For the most part, pattern recognition has helped me uncover winners in this market environment… and that’s what I’m going to stick to.
I’ve uncovered three large-cap stocks at key levels that I think traders will want to keep an eye on.
They just so happen to be at breakout levels, so it’ll be interesting to see whether the sellers push these names down…
Or if the demand overwhelms the supply, and causes them to explode higher.
Three Large Caps At Major Key Levels
Don’t worry, I won’t keep you for long — this will only take a few minutes. There are stocks out there are key resistance levels right now.
Basically, they’re at key points in which if the demand outweighs the supply, they have the potential to run significantly higher.
If there’s too much supply, they’ll likely pull back to a key support level. So let’s take a look at what stocks are at key levels.
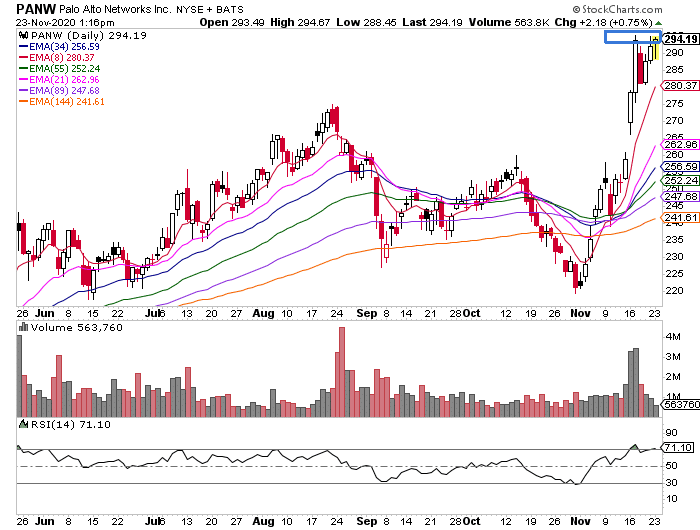
- Palo Alto Networks (PANW) is a cybersecurity company offering a platform that includes advanced firewalls and cloud-based offerings that extend those firewalls to cover other aspects of security
- Last Friday, the stock broke out of a bull flag it was forming at the all time highs. Clear support here is at $280 – $285 (right around the 8-day exponential EMA). Now, PANW has some support around $295. However, if the demand outweighs the supply, I think PANW will test the $300 area, which is the next significant resistance level to watch on the upside
Next up, we’ve got Yeti Holdings Inc. (YETI).
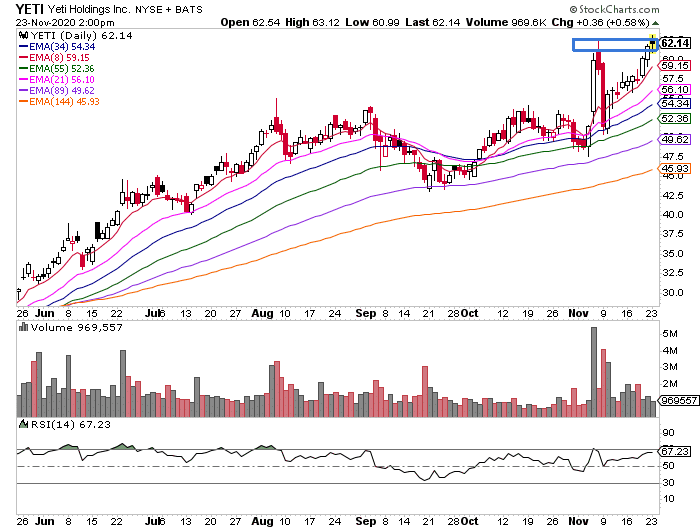
- YETI is an outdoor products manufacturer which specializes in products such as ice chests, vacuum-insulated stainless-steel drinkware, soft coolers, and related accessories
- This chart looks interesting because shares failed to break down after the earnings spike and the stock is now around previous all-time highs. Now, the stock did try to get above today, but I think it’s important to remain patient here.
By the looks of it, this may be a fakeout breakout. If the stock pulls in from here, the support area for the stock is $58 – $60 (the 8-day EMA is at $59.15).
Last, but not least, there’s Sony Corp. (SNE).
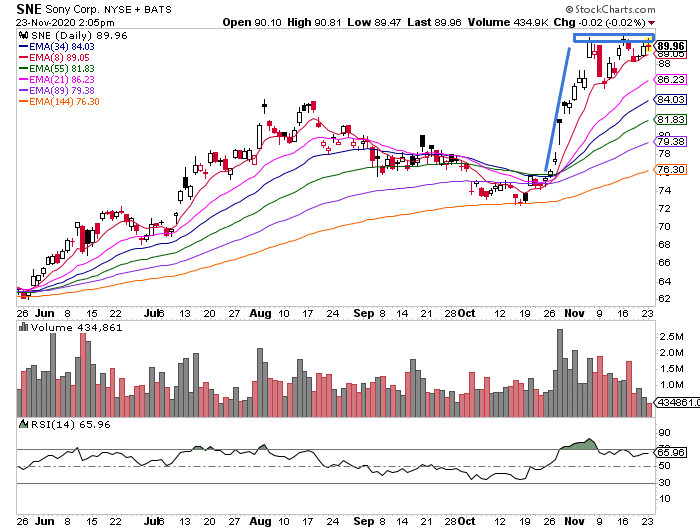
- Sony Corporation (SNE) is a widely known Japanese conglomerate. Most recently the company released Sony Playstation 5 which sold out in Japan on the first day of the launch. That catalyst can cause SNE to break above the $90 level.
- The stock is holding 8-day EMA and is not so far away from the psychological $100 mark. Key levels to watch here are $88 as support area and $91.1 as all time high resistance.
By looking at the charts, I’m able to quickly uncover trade ideas. If you want to learn more about my favorite chart patterns, which are not only useful to uncover trade ideas in large caps, but small caps as well.
Once you find out what they are, I think you’ll be surprised at how often you see them pop up.
0 Comments