There’s so much wild action in momentum stocks and there’s one common pitfall I’ve noticed so many traders are just walking right into.
Instead of trying to time their trades… they see a stock runup, start to have the fear of missing out (FOMO), and just chase…
Only to watch the stock move against them, until they’re sitting at their desk — sick to their stomach, ready to rip their face off.
Listen, I’ve been at this game for about a decade… and there’s one pattern that I believe is perfect for this market environment.
It can actually help traders remain patient and identify key entry and exit points for explosive momentum stocks.
I’m a teacher at heart, so I want to show you how it all works because I truly believe this pattern can be beneficial to your trading.
The One Pattern To Attack FOMO
I think the best way for you to learn how I utilize this pattern is through an example.
I mean you probably already know how fast momentum stocks can move. Typically, I’ve found the momentum stocks I trade don’t necessarily continue running higher. Instead, they make large moves and pull back.
The thing is, these momentum stocks can pull into key areas before they make a move. If traders can identify these levels, I believe it becomes a heck of a lot easier to develop trade plans.
Let me show you how to identify these levels with my “rest and retest” pattern.
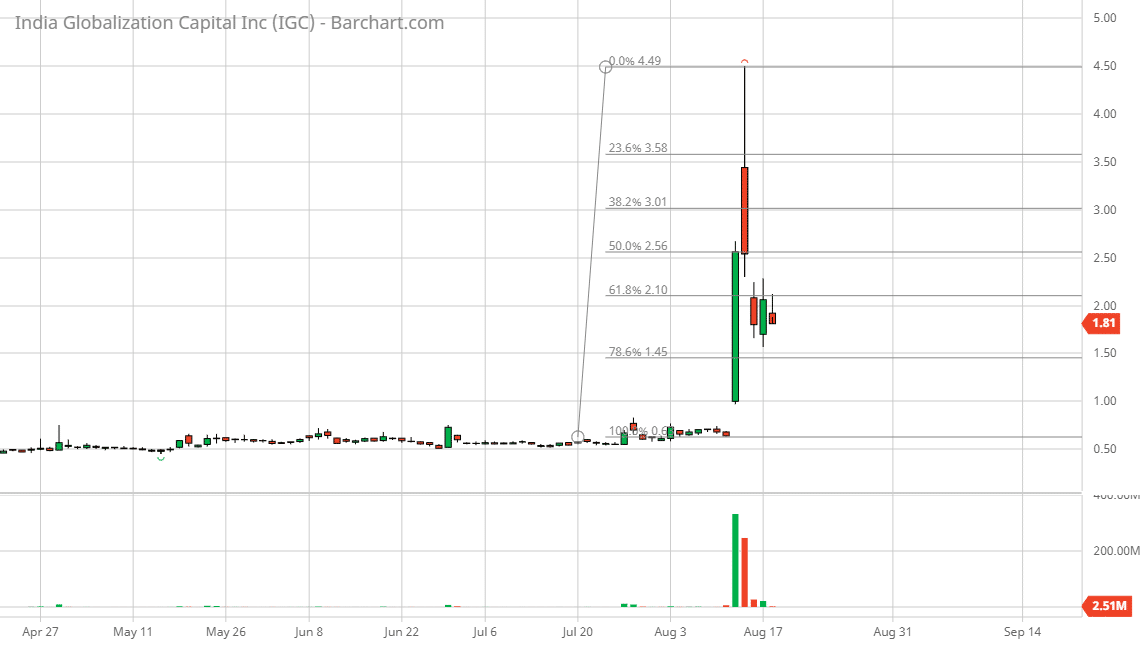
Check out the chart in India Globalization Capital Inc. (IGC) above.
Notice how the stock made a large move higher and pulled back.
Now, this is where the Fibonacci retracement tool comes into play. Most beginner momentum traders will just look to chase that action, and that actually can cause them to get in at the top.
I find it helpful to remain patient and just find the swing high and swing low, then use the Fibonacci retracement tool.
Your charting software or brokerage platform should have these tools. If you ever get need to find any charting tools, you can contact their support team and they should be able to help you out.
Back to the Fibonacci retracement pattern.
If you look at the chart, you’ll notice there are horizontal lines. There are key price levels to keep an eye on because they can signal areas of support and resistance.
In general, I would look at 50% or 61.8% retracement levels for support because the demand is likely to pick up around there. However, I’ve found the 78.6% retracement level has served as key areas of support in this environment.
So what specifically do I do once I spot this pattern?
Well, it’s helpful to devise a trade plan.
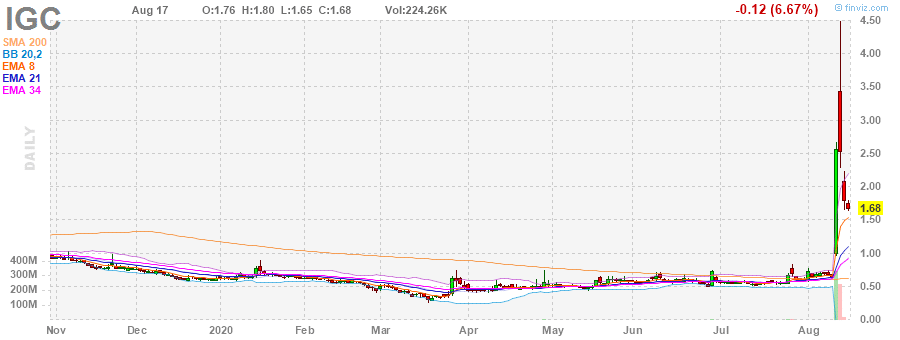
Here’s what I sent out to subscribers on Monday morning…
IGC fibonacci in play above $1.60 with a goal of 10-20% if it comes off retracement. Not something I’m looking to hold for long, probably a day trade if I take it or 1/2 size overnight on a gap. Thinking $1.60 – $1.70 buy zone, goal 10-20% so around $2, stop loss $1.60-$1.50 and then I’d watch it for reentry later in the week.
I wanted to buy IGC between the 61.8% and 78.6% retracement levels, that way the stop-loss and targets were pretty clear.
Once I saw the stock get near my buy zone, I bought shares of IGC… and the stock took off. Around 3 PM ET, yesterday, I locked in about a 20% win* on half my position, and held onto the rest for a potential gap up.

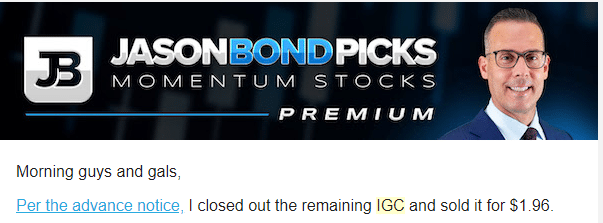
On Tuesday morning, I closed the rest out, as the stock didn’t make the move I expect… but it was still a small win in the books.
I’ve noticed there are a lot of momentum stocks with my bread-and-butter setups. If you want to make trading easier and just look for recognizable chart patterns to uncover trade ideas, then you’ll want to check out my pattern recognition workshop.
You’ll learn the same setups I use to uncover momentum stocks poised to move.
The best part… it’s absolutely free (normally it would cost $300 to attend).
Make sure you take advantage of this exclusive offer now.
*Results presented are not typical and may vary from person to person. Please see our full disclaimer here: ragingbull.com/disclaimer
0 Comments