If you haven’t noticed yet, there are small-cap momentum stocks popping off every single day.
I mean just take a look at the stocks that came up on my filter this morning…
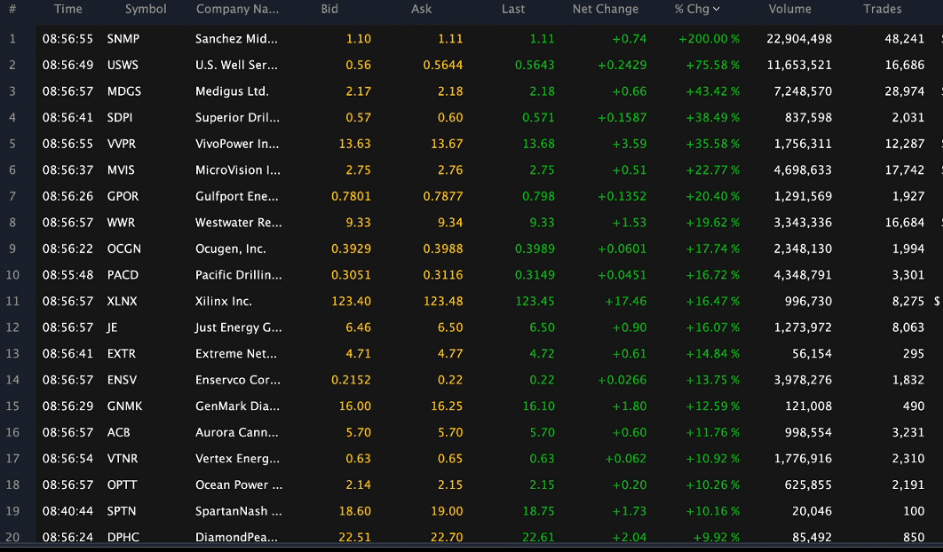
There are stocks moving 30%+, some are skyrocketing by multiple folds overnight. If you’re missing out on all this action, there’s a quick fix in my opinion.
You see, if you can identify chart patterns and understand price action, I believe it’s possible to uncover these plays AHEAD of time…
Or at least ride some of the momentum waves.
Allow me to show you how it works.
My Techniques To Uncover Momentum Stocks Poised To Take Off
When it comes to uncovering momentum stocks, I believe it’s crucial to use a filter. You see, liquidity plays a role when it comes to these names. I don’t want to jump into a thinly-traded stock because that means it might be hard for me to get out.
So in the pre-market, I look for stocks under $30, gapping up with at least $200K in dollar volume.
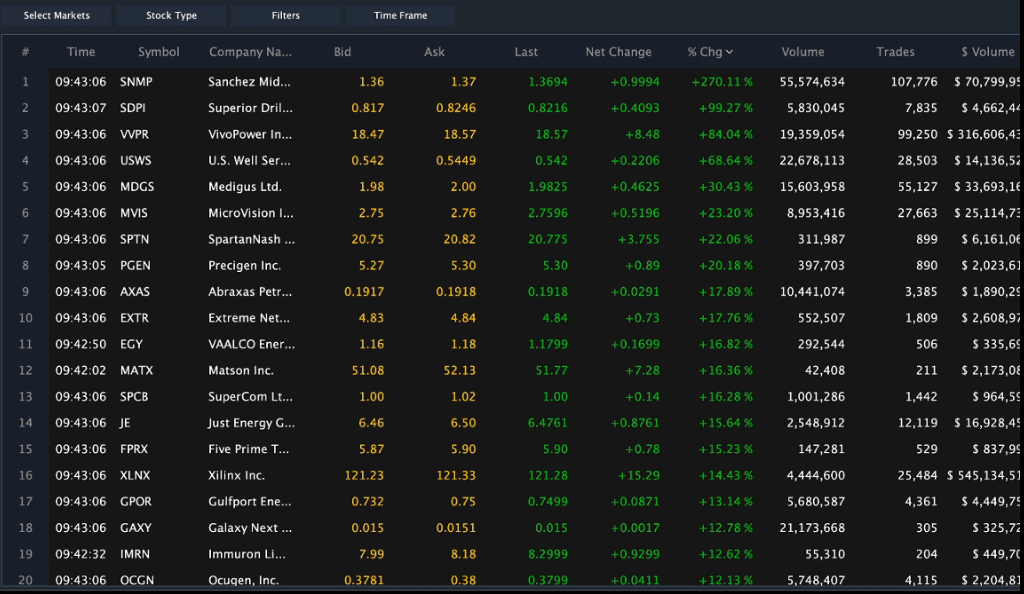
After the opening bell, I change the dollar volume to $2M or more, and look for the top percentage gainers on the day.
Sounds pretty simple so far, right?
From that point, I’ll look at the charts of these gainers (in the pre-market and throughout the day) and analyze the price action. If I see any one of my best setups, I’ll plan the trade and execute.
Take a look at the top gainer on the filter. Sanchez Midstream Partners LLC (SNMP) exploded and was up more than 200%.
With these explosive plays, the rest and retest (Fibonacci retracement comes into play).
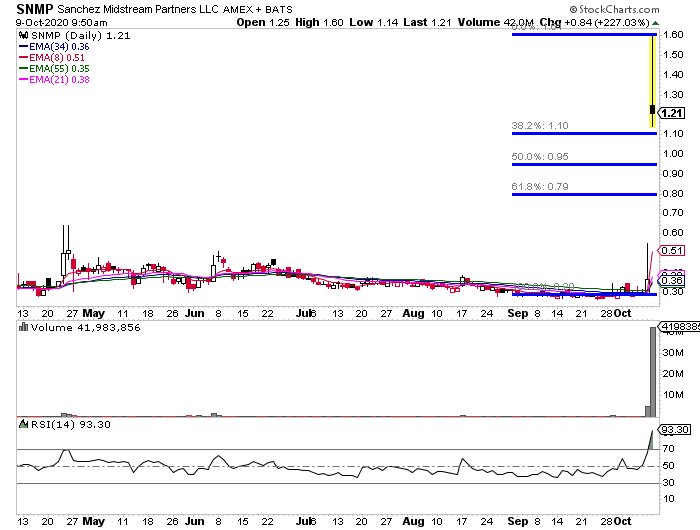
I find the swing low and high, and try to identify key areas of support and execute. So while I might not trade this when it’s rocketing higher, I would look to enter on a pullback to a key Fibonacci retracement level… so I have this one on the watchlist.
Aurora Cannabis (ACB) is one that came up on my pre-market scanner, and I definitely want to keep an eye on this one.
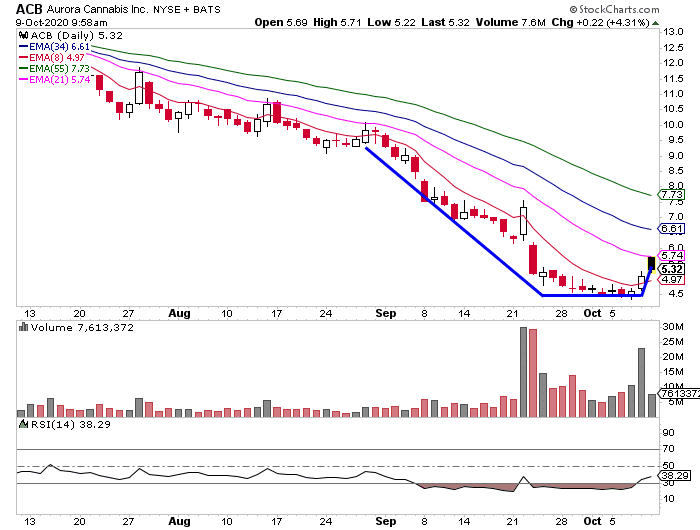
It’s got the fish hook pattern, and I think it can build some more momentum from here.
You see, ACB has 111.94M shares floating, and more than 20% of the shares are sold short. That means if the shorts start heading for the exits, the demand will pop and prices should too. That would attract even more momentum traders chasing FOMO.
In this market environment, timing is key. For me, chart patterns allow me to identify key entry, target and stop-loss areas. I want to show you my favorite ones, and how they help me uncover momentum stocks poised to run.
With this wild price action, I put together my Chart Patterns Cheat Sheet, so you can add some weapons to your trading arsenal and attack the market.
0 Comments