Of course, I could talk about stocks for hours on end — all the bullish and bearish setups, indicators, moving averages, screeners… you name it… but the thing is, I always go back to my two favorite patterns — the fish hook and rocket.
With the event-driven market environment we see nowadays, my fish hook pattern comes up a heck of a lot more often…
Why?
There are traders out there who panic and are quick to pull the trigger, causing overreactions.
Now, when I look for my fish hook pattern, I look for oversold conditions… and then I place my bets. However, I’m not randomly picking bottom, I actually follow a three-step process — and the best part? It’s repeatable.
So today, I’d like to walk you through one chart setup that could help you uncover massive bounce plays after a major overreaction.
How To Find Stocks Poised to Rebound
It’s actually super simple to find oversold stocks. The first thing you have to do is look for beaten-down names, and there are scanners out there that allow you to do this. For example, you can head on over to Finviz, and screen for stocks down say 10% on the week.
You can even filter for market cap, average volume, and RSI… the key ingredients to finding the “perfect” reversal play.
So with the fish hook pattern, all I’m looking for is three things:
- The stock plummets (typically an overreaction)
- The stock finds a support level and starts to come out of oversold territory, based on the RSI.
- The stock starts to catch a bounce.
Sounds easy, right?
Well, it is.
Let me show you how it all works with a recent winner that I reeled in using the fish hook pattern. Check out the daily chart in Overstock.com Inc (OSTK).
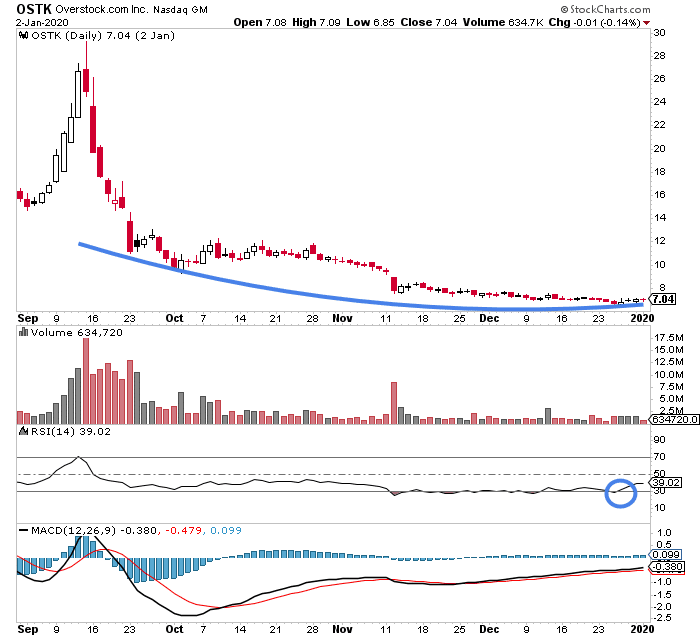
You’ll have to use a bit of imagination for this one… but if you look at the chart above, you can see the pattern kind of looks like a fish hook (almost). Basically, OSTK suffered a massive drop… found a support level right around $7.
Thereafter, it started to catch a slight bounce, and the Relative Strength Index (RSI) broke back above 30. That’s a clear signal the stock could rebound and finish the fish hook pattern.
Now, it also helps to have a thesis with these plays. For example, with the Overstock.com Inc idea, I figured the stock was beaten down during the last few months of 2019… and the “January effect” idea could materialize.
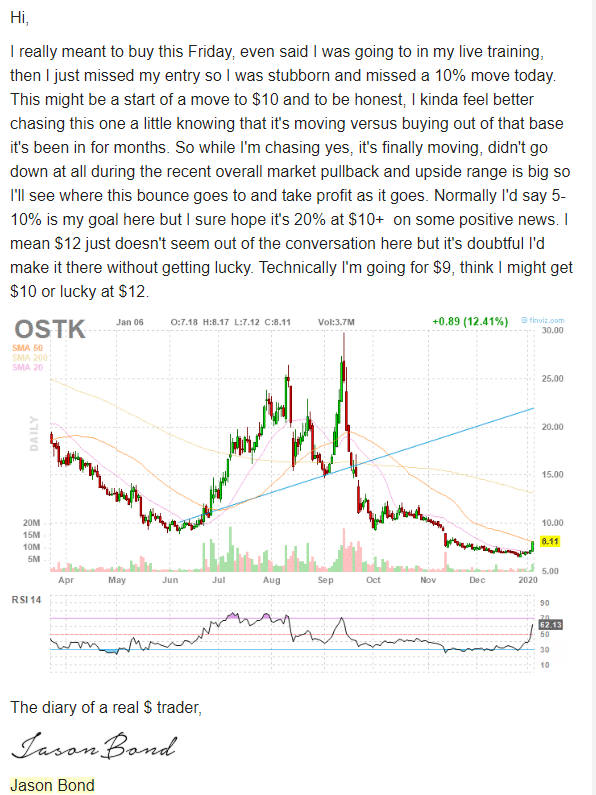
Guess what happened a few days later?
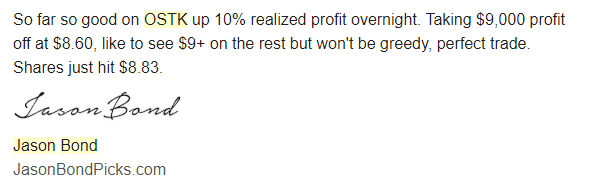
OSTK actually made the move and “finished” the fish hook pattern, allowing me to reel in $12K profits in total.
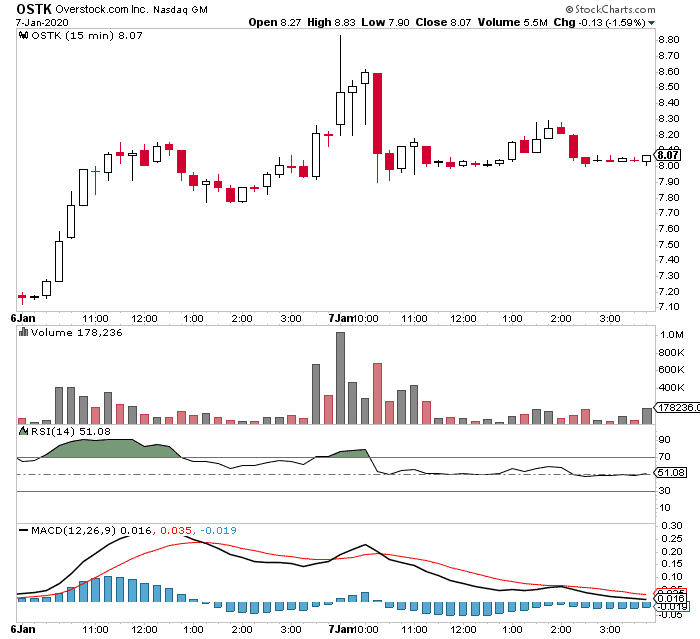
The stock hit a high of $8.83 not too long after I got in… and I sold when the stock gained some momentum. That was good for about a 10% overnight, a $9,000 profit overnight!
I didn’t want to get greedy, so I sold ¾ of my position, and let the rest ride.
Now, for the rest of my position, I actually put a stop-market order. My order got hit… and I locked in the rest of the position for $12K in profits.
In this market environment, trading small-caps is where it’s at… and I expect my fish hook pattern to come up more very soon. The pattern is not only repeatable, but it’s also scalable too. But that’s not even the best part… I have another go-to pattern.
If you want to learn how I use 2 simple wealth patterns to consistently find winners in any market environment, click here to below to watch this training session.

0 Comments