Not even three weeks into 2019… and I’ve rattled off more than $107,000 in trading profits.

Now, I’m telling you this for two reasons:
1) The three simple indicators I use to make money in the market…are working well (nearly $6,000/day).
2) These market-beating strategies are repeatable and I’m going to teach them to you (some today).
You see, the fastest way to get bigger and better at trading is to focus on your best ideas. My strengths are pattern recognition, catalysts, and finding value.
That said, I’m picking three of my best (most teachable) trades of 2019 and breaking them down for you. If you’re struggling to find a consistent strategy, you’ll want to keep reading…
Profitable Chart Patterns for Traders
Now, around a quarter of my profits for the month was generated from just one of my patterns.
These patterns are repeatable and have worked in various market environments… bull markets, bear markets, choppy markets… you name it, they’ve worked time and time again. That said, let’s delve into these patterns and see exactly how I spot trades like this.
Fish hook pattern made up over a quarter of my profits this year so far…
We’re not fishing for bass… we’re fishing for trades here.
Here’s what I’m talking about…
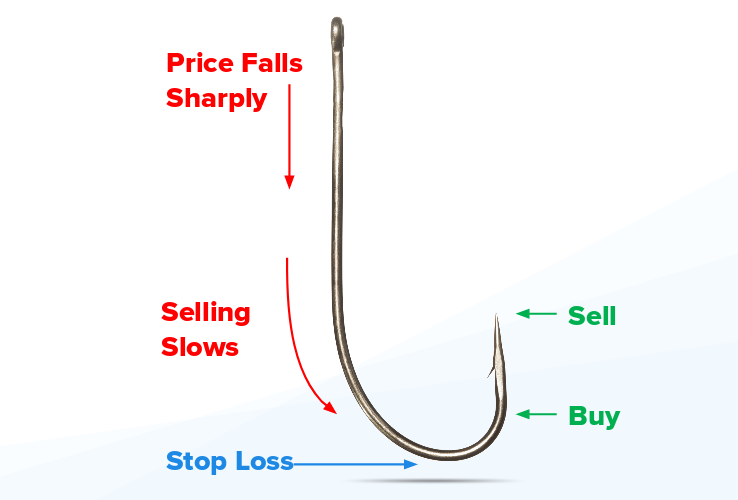
Pretty simple, right?
Check out the daily chart on Veritone Inc. (VERI) below.

Now, look closely at this chart.
VERI had an explosive move in early December 2018… only to pull back over 50%. However, the stock found a bottom – and couldn’t break below $3.65 at the time. That said, I was stalking this chart and sent out watch lists about this pattern to Millionaire Roadmap members. This stock was oversold, according to the Relative Strength Index (RSI), and I was waiting for it to catch a bid.
VERI Trade Off of the Fish Hook Pattern Was Good for $17,000+ in 2 days
I actually traded this stock intraday – before I bought shares for an overnight position.
Here’s what I alerted to Millionaire Roadmap members.

Not too shabby… locking in $3K in VERI off of this pattern. Now, I had conviction, and realized I actually hit this trade last month too – based on the same fish hook pattern.
That said, I decided to add to my VERI position. Additionally, I bought shares of another stock exhibiting the fish hook pattern (more on that trade after).

The following day, VERI had a positive catalyst, and I was locking in $14K in profits…


The fish hook pattern was there again for me in Uxin Ltd. (UXIN).
Fish Hook Pattern Does It Again… This Time in UXIN
Take a look at the daily chart on UXIN…

Does this pattern remind you of something?
Well, it’s the same pattern in VERI… UXIN saw an explosive move last month, pulled back and found a bottom.
It’s really that simple. Once I see this pattern, I develop a plan with an entry area, target, and stop loss area… thereafter, I press it.

Here’s what I sent out to members in Millionaire Roadmap – letting them know I was taking profits in the pre-market.

That said, this pattern could be powerful if you can spot it… but that will take some experience or a mentor to teach you exactly what to look for and how to filter for stocks with the fish hook pattern.
Moving on, I want to give you a taste of another one of my A1 setups.
The Fibonacci Pattern – (I like to call it the rest and retest)
Look at the chart on China Ceramics Co. Ltd. (CCCL)

It looks a lot different than the fish hook pattern… but don’t worry, it’s easy to use.
The blue lines shown above are known as Fibonacci retracement levels. Basically, I look for stocks with an explosive move, and wait for them to pull back into a retracement level and take a breather… thereafter, stocks that have this behavior tend to retest the upper end of the Fibonacci retracement level (the highest blue horizontal line).
Now, here’s a closer look at CCCL.

If you notice, CCCL was trading in a tight range for a few weeks. Now, the stock found support at a Fibonacci level around $1.35. In other words, the stock had a tough time falling below this price, and buyers were willing to buy around that area.
That said, once it was approaching the upper blue horizontal line shown in the chart above, I pressed it because CCCL had a high probability of breaking out.
In just one day, you can see the bullish momentum in CCCL. The stock actually gapped up, and I was locking in $9K in profits – about 46% overnight!

Similar to the fish hook pattern, the Fibonacci retracement could be used in any market environment.
Of course, it’s still very early into the year, but as you can see, you can make a lot of money in the market by mastering just a few simple setups.
Best of all, you don’t have to quit your day job to get started…I’m still a part-time trader and will remain that way.
That said, making money in the stock market is not as hard as some make it out for you to believe. Here’s the easiest way to get started.
The diary of a real $ trader,
Jason Bond

P.S. Are you in a trading slump?
If you’re putting in the effort and not getting the results, it’s probably not your fault. Even if you have a killer strategy, you still need the right trading plan, and mindset to make the big money.
Hey Jason. . . what do you do for a guy who has NO CLUE what you are talking about. . . do you actually explain all this to your clients . . .a complete novice!!! Are you are PATIENT TEACHER. Remember when you were giving the John Kennedy PRESIDENTIAL Physical Fitness Test to your students? There was that overweight student who knew what he scored and didn’t even look up at the ‘grade chart’. . . I feel a little like him. Spending my fixed income and not sure if I can make the grade. . . not a good feeling when you are ‘poor as a church mouse’.
paper trade and stop loss , before use real money, read and understand course material can’t fly before grow some wings patience take time