It’s a news-driven market for sure, and a lot of the action hinges on what the politicians say and do…
At least for the broader market. In this market environment, I’ve been able to uncover explosive money-making opportunities with my favorite chart patterns.
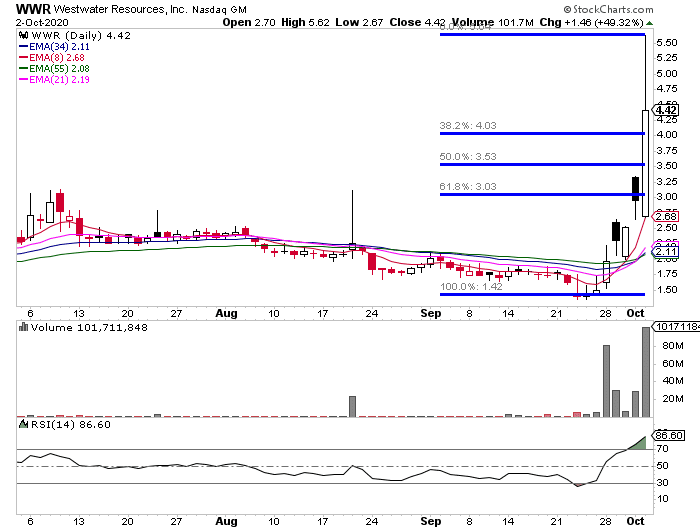
You see, there are small-cap momentum stocks popping off every day, and one of my patterns actually spotted one of the hottest stocks this week — Westwater Resources Inc (WWR).
Today, I want to show you that same pattern and why I believe this pattern is effective in not only this environment but nearly any market environment.
One Pattern That Solves The Problem Of FOMO
Every day, there are small-cap momentum stocks making explosive moves. The key is to time the trade properly, otherwise, you might get stuck with the bag.
One of the main problems with trading small-cap stocks if FOMO. I don’t blame anyone who chases because they have the fear of missing out (FOMO). You see, if a stock explodes higher… how can you possibly know what’s the top or not?
For me, it’s simple. I remain patient and utilize one of my favorite tools… the Fibonacci retracement.
Take a look at the chart in WWR when I spotted the trade.
This is one of my favorite chart patterns and tools to utilize.
Why?
I just have to look for the swing low and swing high, then the Fibonacci retracement tools help me identify key areas of support.
For example, with WWR, one could’ve looked to purchase shares just above the 38.2% retracement, and used that as a stop. The target could’ve been recent highs or above that.
Typically, I’ve found these Fibonacci retracement levels to hold up quite well, and serve as key support levels. In other words, I believe there’s likely to be demand at the 38.2%, 50% and 61.8% Fibonacci levels.
Check out this daily chart in Pioneer Power Solutions Inc. (PPSI).
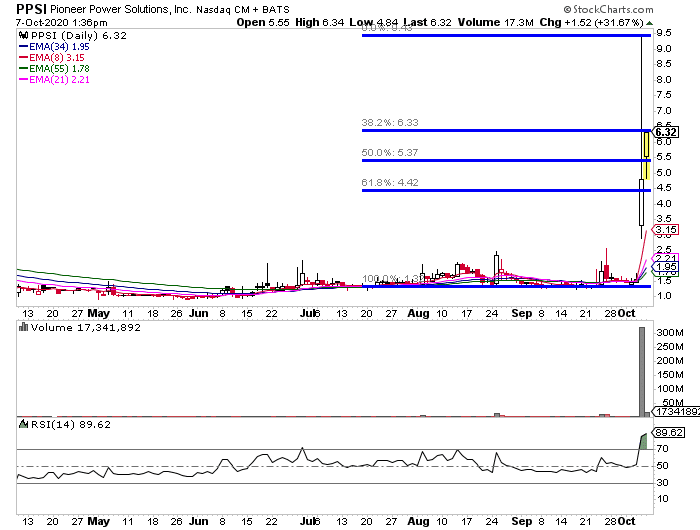
Right there, you can see how powerful these levels can be. For example, PPSI closed above $4.42 on Tuesday (the 61.8% retracement level).
On Wednesday, PPSI opened higher, but tried to get below that area, but failed. So one could’ve purchased shares around $5 with a stop below $4.42. Typically, my target is about 10-20%, and PPSI popped and got above $6.
To me, this was a textbook setup of the retracement.
In this market environment, stocks are moving fast and there’s one factor I believe matters more than anything else… price action. If you’re able to utilize chart patterns, I believe you can get a better understanding of price action and better time your trades.
If you want to find out what three of my best chart setups are, then click here to claim an eCopy of my Chart Patterns Cheat Sheet.
Thanks Jason, for your generous teaching – great tips, etc.!
how many picks do you get per/week or month?
Hi Gary. This depends on what products you use. Please contact support@ragingbull.com to clarify what you can expect based off of the products you have purchased.