Good morning,
Wow, what an interesting week. First, a surprise loss for Geert Wilders in The Netherlands gave a strong boost to the euro/US dollar cross.
Second, the Trump budget is out, and almost every headline I’ve read so far focuses upon cuts to social programs. When the number of days left to a zero balance of the Fed’s account reaches less than, say, one week, then Wall Street may become edgy due to most likely a weaker US dollar.
Is that scenario how President Trump lowers the value of the US dollar in the Forex? I’m half-kidding about this possibility, but more nefarious things have happened in US politics and State Department foreign policy tactics. Do you know what I mean? 😉
Third, and most interesting event, was the market response to the Fed’s announced 25-basis-point hike to the overnight federal funds rate on Wednesday. Following the announcement, stocks rose, the gold price spiked, and bonds rallied, the last of which further flattening the yield curve between the 10-year and two-year Treasuries.
By the close of Friday’s trade, the spread between the two-year and 10-year Treasuries dropped another five basis points to settle at 117 basis points.
In addition, the US dollar tanked to USD Index of 100.17, down 1%, led by a 1.88% rise in the yen, a 0.50% move higher in the euro, and a 2.01% spike in Sterling.
As the DJIA, S&P500 and NASDAQ inching slightly higher this week by 0.06%, 0.24% and 0.67%, respectively, during an unusually strong move higher in the yen, isn’t seen very often in today’s market. But, this week, what appeared on the surface as a resilient stock market in the face of rising short-term interest rates was deception. Let me explain the action I saw following the announced rate hike.
Another way of looking at this week’s price action in stocks is via valuations in other currencies, as, in terms of yen, Sterling and gold. In terms of these metrics, essentially, US stocks sold off, with the rise of the dollar-gold price of 2.4% besting the big moves higher in the yen and Sterling.
So, in all, nominal dollar-denominated stocks prices didn’t rise enough to compensate for the loss of purchasing power of the US dollar. What happened during the second half of the week was a international repricing of the US stock market downward. That’s the way you should look at what happened this week.
Outperforming this week was the Russell 2000, which moved sharply higher by 1.92%, while the loser, the DJTA, sank 1.55%. Once again, the DJTA is diverging from the industrial stocks, quietly trading 5.1% off its high of only two weeks ago, while, in comparison, the S&P 500 now trades within 1% of its all-time high. When I see this divergence, I always wonder if it is the start of weakening industrial stocks, and not an opportunity to play the spread—not at these lofty levels of valuations.
Okay, let’s have an exercise in valuations in terms of international purchasing power, and maybe a better sense of what’s happening beneath the surface in these markets emerges. Below, is a quick comparative analysis of the impact upon the averages when accounting for the purchasing power of the US dollar in the Forex and gold market. The listed percentages represent the amount each index is off its all-time highs when converted to the big moves in the yen and dollar-gold.
In US dollar:
DJIA -1.2%; S&P500 -1.0; NASDAQ -0.2%; Russell 2000 -1.5; DJTA -5.1%
In dollar terms, although the percentage drop isn’t big, the index stands out as an outlier.
In yen:
DJIA -2.4%; S&P500 -2.1%; NASDAQ -1.4; Russell 2000 -4.3%; DJTA -7.1%
In yen, the performance of the DJTA looks worse.
In gold:
DJIA -3.6%; S&P500 -4.9% NASDAQ -1.6%; Russell 2000 -7.4%; DJTA -11.1%
And, price in the international counterweight asset to the US dollar-based central bank reserve scheme, the DJTA reveals that it has undergone a correction. What? I’m stating, that the traditional leading indicator of where the industrials are headed next is declining in nominal terms, and in real terms—a double whammy.
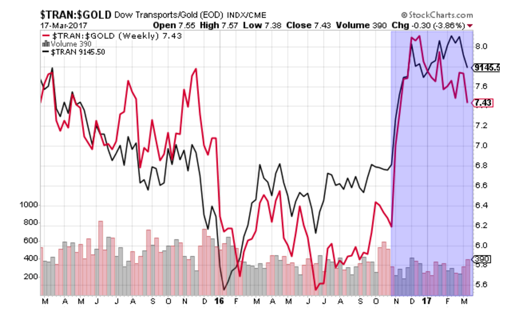
The chart, above, shows the Trump rally (shaded light blue) beginning to fizzle in real terms at the start of December (peak of red line), approximately one month after the US election. In other words, since December, gains in the DJTA (our leading indicator) have been artificially driven by a weaker US dollar against the core asset of the international monetary system: gold.
So, when the DJTA is priced in terms of gold, I can conclude, that the DJTA has lost the equivalent of 2,331 points from the DJIA since early-December. What would the headlines read, if the DJTA dropped 11.1% in nominal terms? The mem would be something like, “Transportation companies are warning us less goods are being shipped.” But with the concurrent softening of the DJTA in nominal terms and relatively stronger dollar-gold, the explanation becomes more intricate and academic to most of mom-and-pop investors.
And as side point to the above, wasn’t GDP for Q4 revised down to 0.9% on Tuesday? And do you remember my comment about the Fed raising rates while the US economy softens?
In the bond market, the US Treasury 10-year yield touched a post-election high of 2.60%, before dropping back a bit, to 2.58%. This is the second-straight week of rising yields of the bellwether Treasury security. A breakout above 2.60% might ring alarm bells in stocks, but I don’t expect the rate to climb much further, as I see renewed safe-haven buying in the data, which may include US Treasury securities in the coming weeks as a result of political uncertainty in Europe and fears of the Fed breaking something, as I’ll get into more in this report.
Didn’t I devote nearly the entire report of last week on this important subject of the FOMC meeting? Go back and read last week’s report. I now see the market now moving toward the assumption that the Fed will ‘break something’. If that something breaking is the US dollar, stocks, or both, we may have seen the start of this process on Wednesday via the US dollar.
Confirmation of the move out of the US dollar came by way of big moves higher in the gold stocks. The GDX and GDXJ rose sharply by 4.33% and 4.58%, respectively.
And note, some large entity sold $1.3 billion worth of Apple stock (AAPL) as a single block at the open of Friday’s trade at the NASDAQ. I know the Swiss National Bank (SNB) owns approximately $65 billion of stock, of which AAPL is its largest holding. Was the SNB behind this block trade? Maybe. But a second half to a week of significant dollar weakness in the gold market elicits suspicion.
And a final observation before we move onto other markets, and that is: since August 2016, the dollar-price of gold bullion has outperformed the GDX by 26.3%. It should be the other way around. The GDX should be outperforming the metal by 26.3%.
So what am I really pointing out? At today’s dollar-gold price, the GDX may begin to play ‘catch up’ to the dollar-gold price during 2017.
And here’s something to think about: relative to the dollar-price of gold bullion, the GDX may be depressed in price by as much as 32.6%, according to my analysis. Therefore, my opinion is: if the dollar-gold price begins to rise further from today’s US$1,230, the GDX may explode higher.
And finally, along with precious metals and strong move high in the copper price, was the rebound in WTIC. After dropping to a three-month low of $47.09 per barrel, the FOMC meeting saved the day in the oil market with a nice bounce in WTIC off its 52-week moving average, and a close higher for the week of $0.89, to settle at $49.31.
Despite the potential of a lower US dollar (insisted upon by the Trump administration), I really think WTIC may still reach $45, and possibly $40, by the end of the year. I see no reason for higher oil prices during record inventory builds at Cushing, Oklahoma and rising rig counts. These two leading statistic spell disaster for any chance of a bull market remaining in WTIC this year, unless, of course, trouble begins in the the most vulnerable counties of the oil industry, Iraq and Libya.
Final note: In all, Dow Theory advises to stay long US stocks. I advise reducing beta risk in your retirement funds and other nest-egg accounts. Far out-of-the-money puts (10%?) and/or holding gold bullion are the two most popular strategies for mitigating large moves down in aggregate portfolio valuations. Do it.
Okay, let’s talk about stocks.
My current portfolio: LQMT, CROX, LC, ANGI and GRPN
This Week’s JBP Stock Ideas
There were no trades this week, but that doesn’t take the steam out of the second half of this week’s report. For those who had room in the cash account to take a position in Castle Brands (ROX) on Monday morning, scored pretty large this week.
This week, four of my five holdings fared well. Moves higher in CROX, LC, ANGI and GRPN offset a down move in LQMT. I like LQMT for the long term, so, all in all, the week was okay.
Now, back to ROX. Minutes after my recommendation to research ROX, the market opened, and away the stock went with an opening price well-above the stock’s 200-week moving average. Wow.
Monday’s 19% surge followed with consolidation and volatility on Tuesday, Wednesday and Thursday at prices between Monday’s open and high prints. That’s a good sign of market digestion. But, on Friday, another 11.8% surge spiked ROX to as high as $1.23, before settling the week at $1.21, up $0.22 (22.1%).
So, what happened? Apparently, the company submitted an 8-K with the SEC regarding an update to the company’s business, of which the details of the update were presented at the 29th Annual Roth Conference held in California between March 12 and March 15.
I don’t have a copy of the Castle’s presentation, but as I noted in last week’s report, the stock could be very hot in 2017 based upon facts we already know.
And on a personal note, the action we saw this week in ROX serves to confirm my nose for hidden plays still works.
As I stated in the text about Castle Brands, below, a better-than-expected earnings report, scheduled for May, is most likely now expected, with a rally in the share price of ROX also most likely as we approach earnings scheduled in May.
Will this expected rally be orderly, or violent? No one can predict that, of course, but considering the stock’s float is quite tight when taking into account the approximate 41% of outstanding ROX shares held by directors and management, as well as the ‘whale’ investor (Phillip Frost: 43.3 million shares) who holds more than half of the remaining shares, the setup is potentially explosive, as we’ve just seen this week.
All I know is, that when Wall Street decides to buy this stock, there are not many sellers willing to part with their shares at meager percentage points gains from their entry prices. My guess is: more than 75% of the stock’s issuance is held by hands not willing to sell at anywhere less than $2.
MY WATCH LIST
SIENTRA (SIEN)
Sientra (SIEN), a maker of silicone breast implants and a budding successful turnaround story from an unfortunate factory stoppage at its third-party manufacturing facility in Brazil, Silimed Industria de Implantes Ltd. A little more than a year ago, due to a European regulatory agency issuing a marketing suspension of all products made at the Brazil plant, after flaws were found in some silicone implant products made at the facility, trouble came to Sientra, but through no fault of theirs.
Although Sientra manufactured implants at the plant employed production standards approved by the US FDA, and were independent of other processes at the facility, Sientra voluntarily suspended operations in September 2015 until a third-party inspector verified Sientra’s implants were not among those produced by the methods of other Silimed customers exporting to the European market.
Following the news of Sientra’s voluntary production suspension, the share price of SIEN crashed to as low as $3.34 by mid-November, from a high of $26.67 reached in late-June.
As a result of the work stoppage, Sientra’s revenue plummeted in Q1, Q2, Q3 of this year to a fraction of the company’s Q3 2015 peak sales performance. But since the stock’s November low, SIEN is coming back steadily following an announcement in early-February 2016 that stated the Brazilian plant is again operating and shipping product.
Previous customers who suspended orders to Sientra are coming back to the company, who, at the height of Q3 2015, supplied between 7% and 12% of all implants to a US market, with estimates ranging from $200 million and $300 million per year of revenue, and growing.
On December 5, 2016, SIEN soared to as high as $10.22 (27.6%), following a news release by the company of an FDA pre-market supplement (PSA) approval for the company’s four new implant styles and shapes. These new products will be added to its present line of nine offerings. The company expects to begin delivery of the four new implant in Q4 2017.
My take: I like the stock for its hidden future trend of higher revenue, as the results of a survey conducted by the company of the customers affected by the work stoppage at the Brazilian plant indicated that nearly all customers expect to order Sientra products again when they become available.
And there is a good reason for this nearly-perfect positive response.
First, Sientra is the only company of the three operating in the US (the other two: Mentor, Natrelle) who offers a two-year guarantee against ‘capsule contracture’, an issue of primary concern of most patients and surgeons. Sientra’s rate of contracture is, indeed, the lowest of the three makers. And the company also hold the distinction of offering implants with the lowest in incidents of rupture.
This is a big deal, as far as I’m concerned. Imagine if you were undergoing an implant procedure. Wouldn’t you want an implant with the highest reputation of product safety? Of course, you would.
Second, patients report that Sientra implants feel more natural, which is definitely another big win for Sientra.
In short, Sientra’s implants are best of breed, which weighed heavily on my decision to engage this stock. I expect revenue to regain the $10 million-plus per-quarter level.
Read Sientra’s Quick Fact Sheet
ABOUT SIENTRA
Sientra, Inc., a medical aesthetics company, develops and sells medical aesthetics products to plastic surgeons and patients in the United States. The company offers a portfolio of silicone gel breast implants for use in breast augmentation and breast reconstruction procedures; and breast tissue expanders. It also provides body contouring and other implants, including gluteal, pectoral, calf, facial, nasal and other reconstructive implants. Sientra, Inc. was incorporated in 2003 and is headquartered in Santa Barbara, California.
Source: Finviz.com
CASTLE BRANDS (ROX)
If you’ve been watching the wire, you’ll already know that ROX is the latest hot small-cap stock on the NYSE, following a February 28 announcement that it had inked a deal with Walmart to supply 4,500 stores with America’s no.1 ginger beer brand, Goslings. As of March 1, Goslings Stormy Ginger Beer and Goslings Stormy Diet Ginger Beer are available on the shelves of approximately 40% of Walmart’s entire chain.
On the day of the announcement, the share price of ROX soared to as high as $1.45, from an opening price of $0.72, a 101.3% spike. The stock then succumbed to profit-taking, before heading back up the chart to $1.21 Friday. I’m still long in the Day & Swing Trading newsletter and on the lookout for a Long-Term newsletter position too. The 200-week moving average has served as a magnet for the stock, as on the day of the announcement the stock violently traded in a broad range, yet closed at the 200-week moving average. This week, the 200-week moving average was once again a wall for the stock.
Given the comparative market capitalization of the company against its competitors (much larger, too), the stock may easily reach $6 per share, if Wall Street begins to price the stock closer to the company’s industry peers.
Here’s why I like the stock, and expect power moves higher in the future, taking out the overhead resistance at the 200-week moving average at approximately $1.00.
- Revenue growing at CAGR of 20.5% since 2013 and accelerating. In 2016, revenue rose 25.7% in 2016. Gross margin has increased each of the past four years. Operating profits and net income have increased in each of the past four years. Strong balance sheet.
- Consistently grown core brands faster than industry average
- Directors and officers own approximately 41% on a fully-diluted basis
- Shipments of Jefferson’s Bourbon increased 45% to 61,000 cases in fiscal 2016, compared to 42,000 cases in fiscal 2015. § Shipments of Goslings Rums in the U.S. increased 8% to 135,000 cases in fiscal 2016, compared to 125,000 cases in fiscal 2015. § Shipments of Goslings Stormy Ginger Beer increased 56% to 1,115,000 cases in fiscal 2016, compared to 715,000 cases in fiscal 2015. Castle Brands holds an exclusive market agreement for Goslings brands in the United States. Agreement with Walmart for the United States’ no. 1 ginger beer, Goslings Stormy Ginger Beer and Goslings Stormy Diet Ginger Beer, is a monopoly.
- Public drinks companies trade between 5x and 6x revenue and 16x and 20x times EBITDA. ROX trades at only 2.63x revenue. Castle Brand’s closest competitor (by revenue), Remy Cointreau (RCO:FR), trades at approximately 4.28x revenue and 22.7x EBITDA.
Frankly, although this stock has recently gained attention on Wall Street, the stock is grossly depressed at even the $1.50 level.
Earnings won’t come out until mid-May, at which time I expect fireworks. In the meantime, I’ll be watching this stock closely, as I may take a position in ROX at anytime between now and early-May, the latter time of which I expect a ramp up in the stock price as we approach earnings. The company will have one month of sales to Walmart reflected in revenue, so I (and the world) will be able ascertain whether to continue holding the stock (based on assumption I buy the stock into earning) as a long-term play, or not.
ABOUT CASTLE BRANDS (ROX)
Castle Brands Inc. develops, markets, imports, and sells beverage alcohol products in the United States and internationally. Its product categories include rum, whiskey, liqueurs, vodka, tequila, wine, and other spirits, as well as ginger beer and ready-to-drink cocktails. Castle Brands Inc. was incorporated in 2009 and is based in New York, New York.
Until next time…
Trade Wise and Green!
Jason Bond
Watch For Weakness In Sientra, Johnson & Johnson, and Allergan NBC News Reports That FDA Says Breast Implants Can Cause A Rare Form Of Cancer That May Have Killed At Least 9 People
3/21/17 4:49 PM ET (Benzinga) Hot Stories
Heads up if you didn’t see this.