Man, what a wild market it’s been over the last few sessions. It seems as if traders may be betting on an economic recovery at these levels. With so much price action in the market, I believe I’m in a position to uncover momentum trading opportunities.
Why do I think that?
Well, I’m noticing my patterns are popping up when I scan for potential stocks to trade… and today, I want to show one stock that was on my watchlist yesterday — Cars.com Inc (CARS).
You see, while I didn’t take the trade, I believe there’s a teachable moment here… because I believe I could see this pattern pop up again.
[Revealed] The Gap Recovery And Go Pattern
Have you ever seen a stock or the market gap up or down? In other words, it opened a lot higher (or lower) in relation to the previous day’s close.
Typically, this occurs due to a catalyst — whether it be a major market news headline or company-specific news. There are a number of reasons why a stock can gap up or down.
Now, over the years I’ve taught many lessons on gap recovery and go. CARS was on the watch list yesterday morning for just that.
Here’s what I sent out to subscribers…

Now, here’s a look at the chart in CARS…
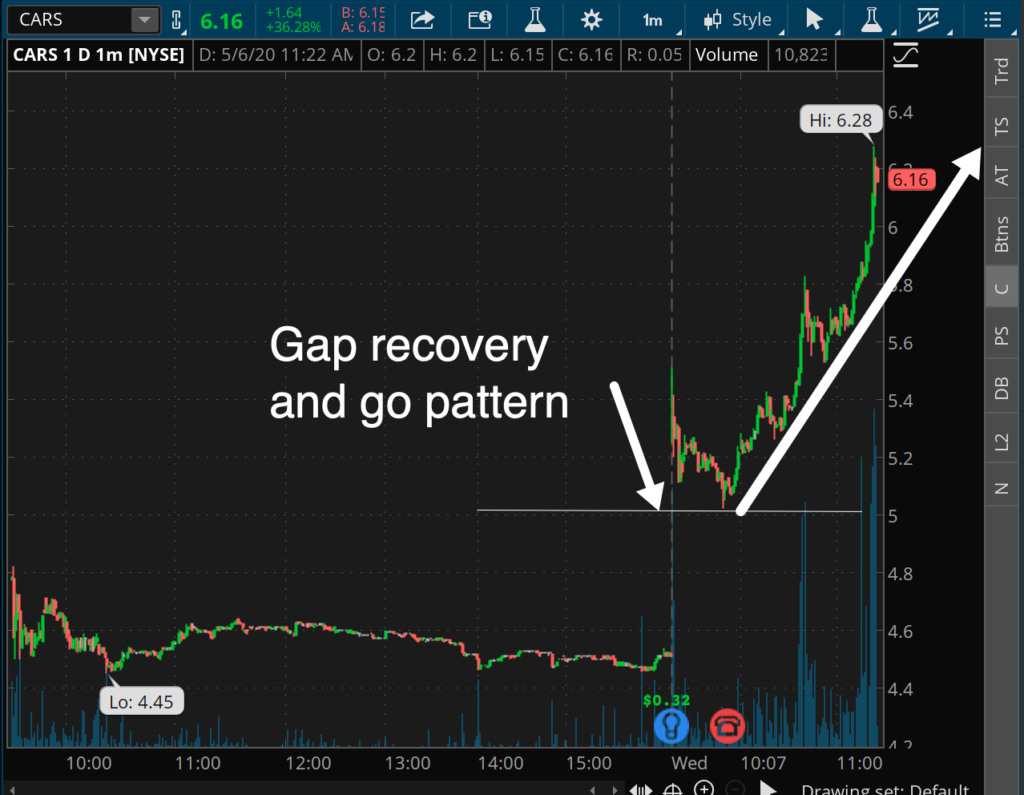
Source: thinkorswim
Notice how the stock opened around $5.50, pulled back to $5, and then ran up and broke above $6?
I believe this happened because, at the open, traders who bought the stock BEFORE the news were taking profits into the gap higher, causing some gap recovery.
Additionally, shorts know this so they pile in too, adding to the initial drop from $5.50 to $5.
However, when it comes to this type of momentum stock, I believe the real buyers would step in right around $5. Consequently, the momentum in the stock could build… and the real move unfolded. I find this is a very common pattern on earnings winners and news winners.
With CARS, the company actually beat the street’s earnings expectations… and since the stock suffered a significant drop amidst the coronavirus pandemic, the shorts actually piled up. More than 14% of the stock’s publicly-traded float… and when there’s good news, the shorts may want to get out.
Of course, I’m a little bit mad because I missed out on the trade.
However, I believe there’s one technical indicator I’ll be more focused on for these plays — the Fibonacci retracement.
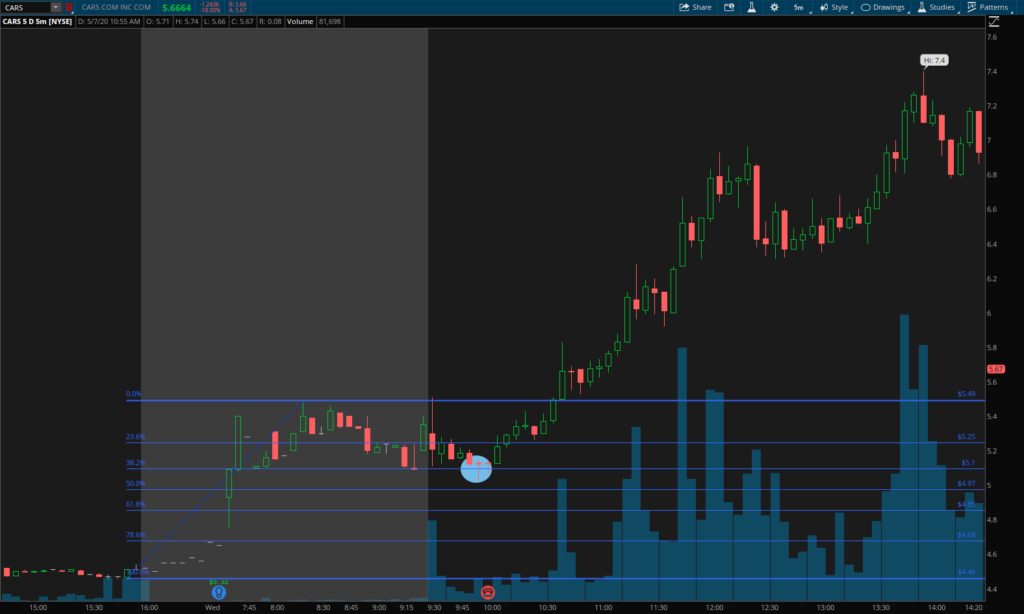
Source: thinkorswim
Now, if you look at the chart above, and the blue encircled area… CARS was actually right between two key retracement levels, and that is an area of value to me. Basically, I could’ve bought shares around here and stopped out if it broke below the 50% retracement level.
You see, if it broke below that, that would indicate the pattern is broken and it’s probably headed over. The target here would be 10 – 20% return.
However, if you look at the chart in CARS… it had a monster move and actually got above $7 at one point yesterday.
I believe I’ll continue to see momentum trading opportunities… and if I see my patterns come up and actually take those trades, I believe I’m in a position to profit. Now, if you want to learn how I hunt down momentum stocks, then watch my exclusive momentum trading masterclass.
0 Comments