Now that there’s a bit of clarity in the market — I’ve started to look for my best setups in tech stocks, in addition to getting back on the saddle with small-cap momentum plays.
While most traders will be reactive to the market once the headlines come out the woodwork, I’ll stick to my guns and focus on the price action.
Listen, I’ve been teaching traders how to recognize reliable and scalable chart patterns for years because they’re just so darn effective…
Especially if you have a tough time dissecting the catalysts on the table.
So let me show you what patterns I’m seeing in some of my favorite tech stocks, key levels to focus on, and how to potentially play them.
Tech Stocks Raging, Key Levels To Keep An Eye On
Let’s start with Apple Inc. (AAPL).
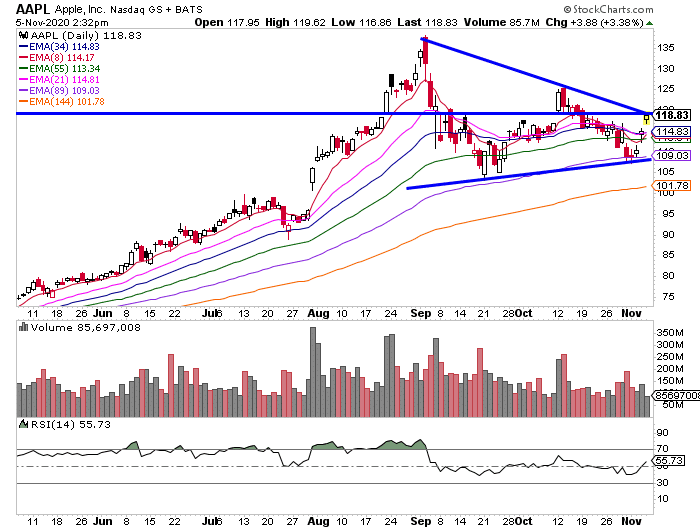
The stock has a symmetrical triangle pattern and it’s right at the upper trend line. I want to keep an eye on the stock around this $120 level, if it breaks out… I think it’ll test the $125, and above that, it might try to take out highs.
Some ways to play this would be to purchase ATM calls with 4-6 weeks until expiration. Another way to play this would be to find a support level and sell a put spread around that. For example, the $110 level looks like a support level, so one could sell the $110 puts and simultaneously purchase the $105 puts expiring in say two weeks.
Next up, there’s Facebook Inc.
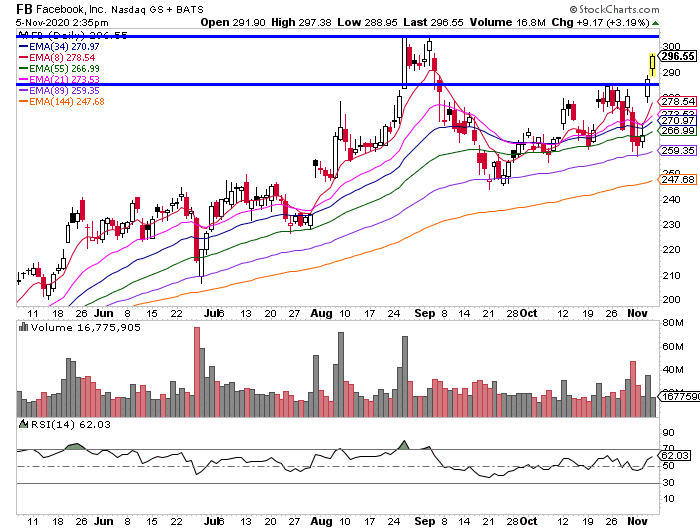
The $300 level is one key area to keep an eye on. This is a triple top pattern, and if you know me… I try to play for breakouts utilizing this pattern because I don’t typically see triple tops hold for long.
One way to play this would be to purchase ATM calls expiring within a certain timeframe. For example, I might look to buy the $295 calls expiring in say a month or so. On the flip side, I can also look to sell a put spread if I’m bullish on FB.
Last, but not least, every trader’s favorite electric vehicle company, Tesla Inc (TSLA) is on my watch.
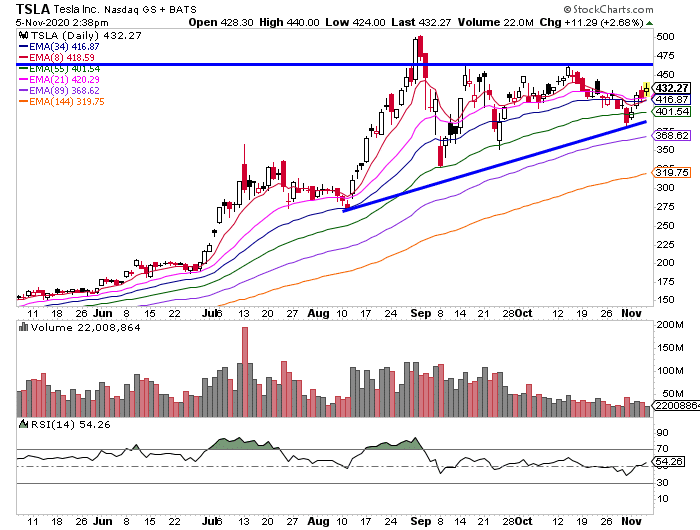
There’s an ascending triangle forming in TSLA on the daily chart, and one key level to watch is $450 – $460. If TSLA breaks above those and stay above, then ATH are in play.
Again, if I were to trade this I can either look to buying ATM calls, or selling a put spread to establish a bullish opinion.
Listen, right now, it’s easy to get caught up in the news. That’s why I want to focus on chart patterns to uncover trade ideas. Let me show you some of my best setups, and how I utilize them to attack the market.
If you’re serious about navigating this market and uncovering momentum stocks before they run, then I urge you to attend this special training session.
0 Comments