Right about now, you’re probably looking through all the headlines and news outlets to try to figure out what’s going on.
The market was raging in the morning session, and yet we still don’t have any clarity yet… and it’s too close to call.
If you want to find trade ideas from the talking heads, by all means do so. However, I think it’ll hurt more than it can help.
You see, right now — there’s one factor that matters the most…
Price Action
For me, focusing on price action not only makes trading simpler for me — but it also puts to bed one factor that can ruin traders… analysis paralysis.
That said, let me show you why it’s important to filter out the noise and how chart patterns can help to navigate through this market environment.
Keeping It Simple To Avoid Analysis Paralysis
We live in a day and age where we have mountains of information within our grasp, all we have to do is click a button and bam we are hit with a tidal wave of data.
This great feat in technology has come with a whole new burden.
A particular burden that can weigh heavily on a trader’s shoulders ─ especially inexperienced and stress traders.
With a wealth of data constantly flowing traders can be swept out to sea by a riptide of anxiety.
This is known as analysis paralysis.
It can be the culprit behind:
- Heightened trading anxiety
- Freezing at the keyboard
- Crippling frustration
- Even your raised blood pressure!
While it seems that having more data would lead to better choices it actually can prove to be the opposite.
Instead of the fountain of information leading to better decisions, it can stop people in their tracks by igniting their fear of making the WRONG choice. Which leads to not making a choice at all.
Famous psychologist Barry Schwartz has rocked the world with his theory of the Paradox of Choice…
“Choice has made us not freer but more paralyzed, not happier but more dissatisfied.”
This Mental Hurdle Can Damage A Trading Account
This mental hurdle could not be truer and when it comes down to trading its costing you big.
Traders find themselves locked into a continuous loop. Analyze everything. Overthink moves. Frozen in place and mentally taxed to the max.
Many traders, including myself, have been stopped in our tracks by a bad case of analysis paralysis.
Overloaded and weighed down by what was thought to be the wealth of information. Only to discover that we have been bogged down by choices.
So how can you stop analysis paralysis from holding you back?
How To Conquer Analysis Paralysis
The first step I had to conquer was accepting that not every trade I made was going to be perfect.
I had to push my obsessive worry aside. Embracing the fact that if I did nothing, I wouldn’t even have a chance to make something.
Instead relying on my years of skill and experience to support my choices.
Next, I set up my trading plan. This should include where you want to buy, stop out and take profits.
This way I can go into a trade knowing what my end game is. Sorting through the mass of choices out there and selecting opportunities I want and can capitalize on.
I always keep K.I.S.S (Keep it simple, stupid) in mind when trading. Remembering not to overcomplicate and overthink my trading strategies.
By keeping a simple and easy to follow trading strategy I cut many factors that can lead to a trade going awry.
This handy habit allows me to enter and exit positions in this choppy market at a lightning-fast speed if needed.
Let me show you how to develop a trade plan.
Kandi Technologies Group Inc (KNDI) was one stock that popped off today, after there was a positive catalyst this morning.
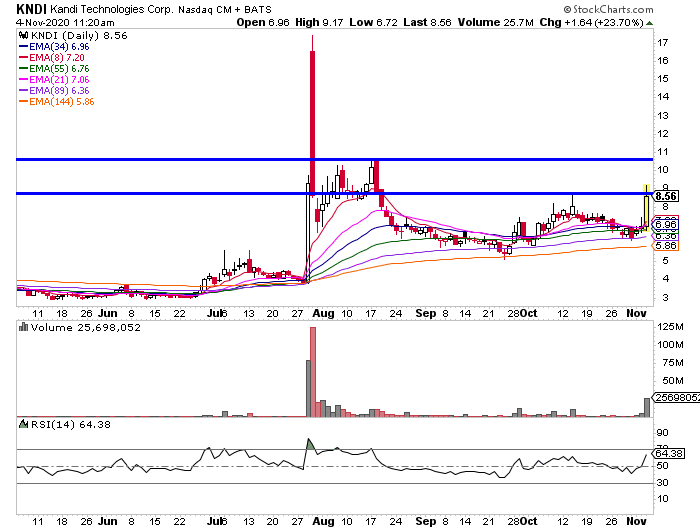
If KNDI can close above $8.50 or so, I see this as bullish action and momentum can build in the stock. With that in mind, a target area could be the key psychological level at $10 for a portion (then sell the rest around $10.50, a previous resistance level).
So let’s say I get long around $8.60 – $8.70, my stop loss would be about 10% lower from that area because if it doesn’t stay above that means the pattern is broken.
Seems pretty simple, right?
If you want to learn how to utilize chart patterns to uncover trade ideas, then I urge you to attend this exclusive training session here.
You’ll discover techniques I utilize to keep trading simple and avoid analysis paralysis.
0 Comments