Over the weekend, I gave readers a heads up about a potential gap down today… and what do you know, futures were down more than 1% in the morning session. This could be the start to a correction, especially with major companies like Apple (AAPL), 3M (MMM), Advanced Micro Devices (AMD) and Starbucks (SBUX) reporting this week.
The one question traders have on their minds right now is whether they should buy the dip or pile in short. For me personally, I’ll be looking for smoke signals in stocks and short if the charts tell me to do so.
I’ve already seen some smoke signals pop up in the overall market, but now’s the time to look for stock specific plays as well. In order to find bearish trades, I’ll be looking to one simple technical indicator — one that lets me know whether a stock is oversold or not.
I think those plays will be the best ones if this selloff continues.
So how am I going to find these plays?
Is It Time To Get Bearish On Stocks?
One indicator that’s great for letting you know which stocks to potentially short is the Relative Strength Index (RSI).
So what’s the RSI?
Basically, it’s a momentum indicator that lets us know whether a stock is in overbought or oversold territory. It’s one simple line and all you have to do is be mindful of the extreme conditions.
Generally, if the RSI is above 70, the stock is considered overbought. On the other hand, if it’s below 30, the stock is in oversold territory. Since I’m looking for potential short plays, I’ll be focused on the 70 level.
The good thing is, we don’t have to sift through thousands of stocks to find the ones that are overbought. There are actually filters out there we can use. For example, Finviz offers a screener that lets us know whether stocks are overbought.
Here’s a look at a simple RSI filter.
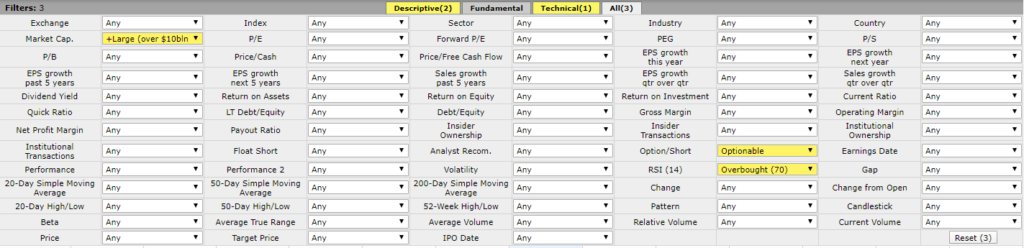
I’m looking for large-cap stocks that are optionable with an RSI above 70. Now, you can play around with the RSI and look for even more extreme conditions.
For example, one stock that came up on this filter was AAPL.
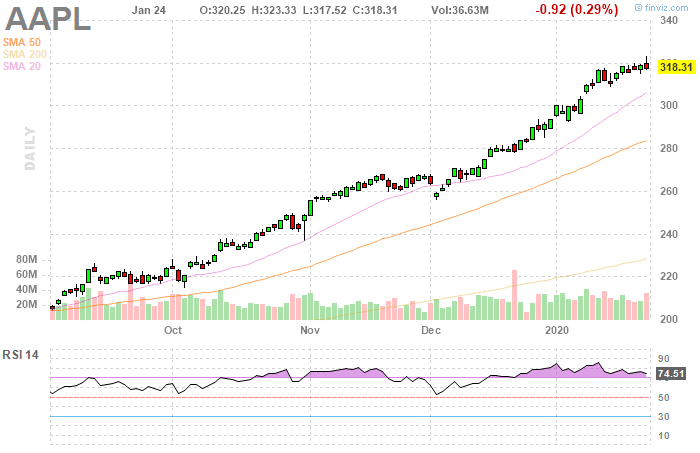
If you look at the chart above, AAPL has been on an absolute tear, as the market continued to make all-time highs. Right now, APPL’s RSI stands at 74.51 (overbought territory). With earnings on the docket, I would put this on my watchlist and keep an eye on what it does after its earnings date.
Now, if it breaks below key exponential moving averages, such as the 8-day exponential moving average (EMA) and the 21-EMA, I think AAPL could head much lower.
Here’s a look at another large-cap that came up on the filter — Autodesk Inc. (ADSK).
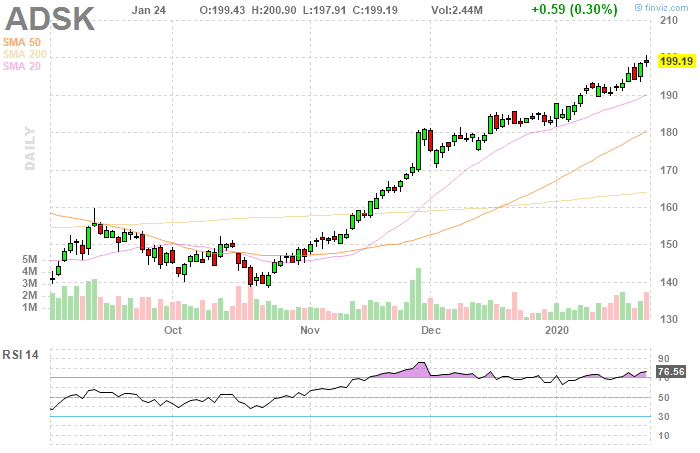
Similar story here. The stock caught a major move and has just been on fire the last few months. If you look at the chart above, the RSI is in overbought territory… and that’s a signal traders could start to dump this name… especially with so much risk on the table.
I know what you’re wondering… Jason, does this actually work?
Yes, if you can time your entries properly.
Let me show you how it all works.
Case Study: Shorting Overbought Stocks
I recently spotted an overbought signal in GSX. The stock had a major move, and its RSI was at 93. That meant the stock was extremely overbought. Not only that, but the stock has earnings coming up. So that meant traders could start to sell the stock to reduce their risk and lock in profits.
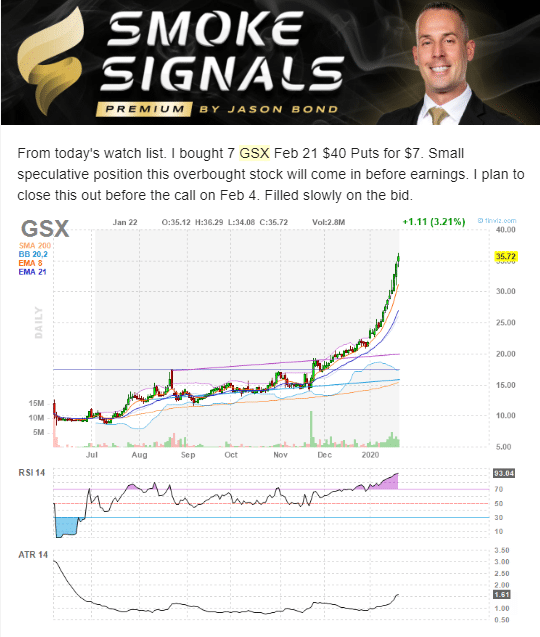
Once I saw that chart setup, I took a stab and bought the puts. You see, when you use options, it actually reduces your risk and increases your profit potential on a percentage basis.
With the GSX play, the stock actually pulled back and it could be the makings of a potential plummet in this name. However, with earnings coming up… I decided to lock in some profits and look for better Smoke Signals plays.
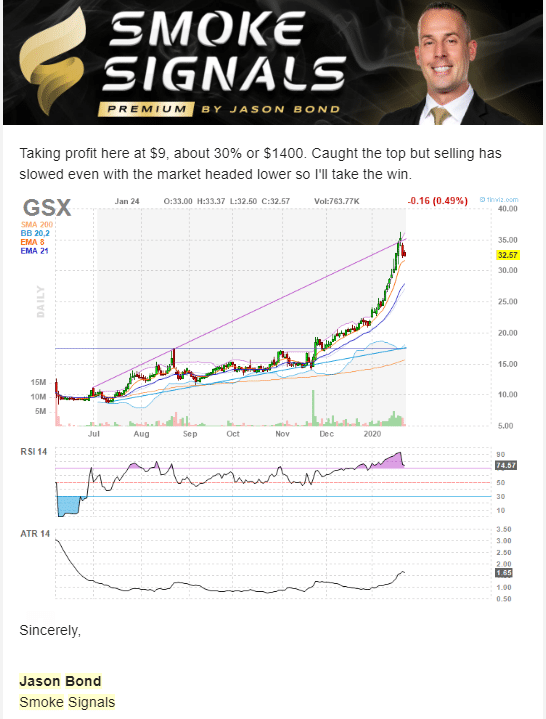
In just 2 days, I was able to lock down a 30% winner in GSX, just by looking at the RSI and the chart setup.
It’s really that simple.
With a potential market crash in the cards, I think the RSI will be a useful tool for me to continue finding bearish setups. However, that won’t be the only smoke signal I’ll be looking at. If you want to learn how to profit if and when the market crashes, then click here to see what Smoke Signals is all about.
0 Comments