There’s one stock trading under $3 that I have on my radar right now.
Sure, there are catalysts on the table for the company, but what really caught my attention was the chart pattern.
It’s one of my favorite setups to use on stocks that have made a large move and pulled back.
Why?
It helps me pinpoint which area I should look to buy shares of the stock, and where it would be wise to lock in gains.
I’ve found this pattern is especially useful in this market environment.
I know what you’re wondering…
“What’s the stock you’re referring to, and what pattern are you talking about?”
Is This Coronavirus Stock Set To Make A Move?
Precipio Inc (PRPO) is one momentum stock that looks extremely interesting to me right now. Last week, the company announced it launched its Covid-19 antibody test commercially to its pathology customer base.
It’s currently in Phase 1, and if it gets approved for expanded use by FDA… the company would broaden its distribution channel.
The stock made a large move from less than $2 and hit a high of $8.13.
However, since it moved up so fast, it suffered a large pullback.
Typically, traders will often forget stocks after they have a significant pullback, and I really don’t know why…
Especially when there’s a pattern that can signal a rebound.
Take a look at the 4 hour chart in PRPO.
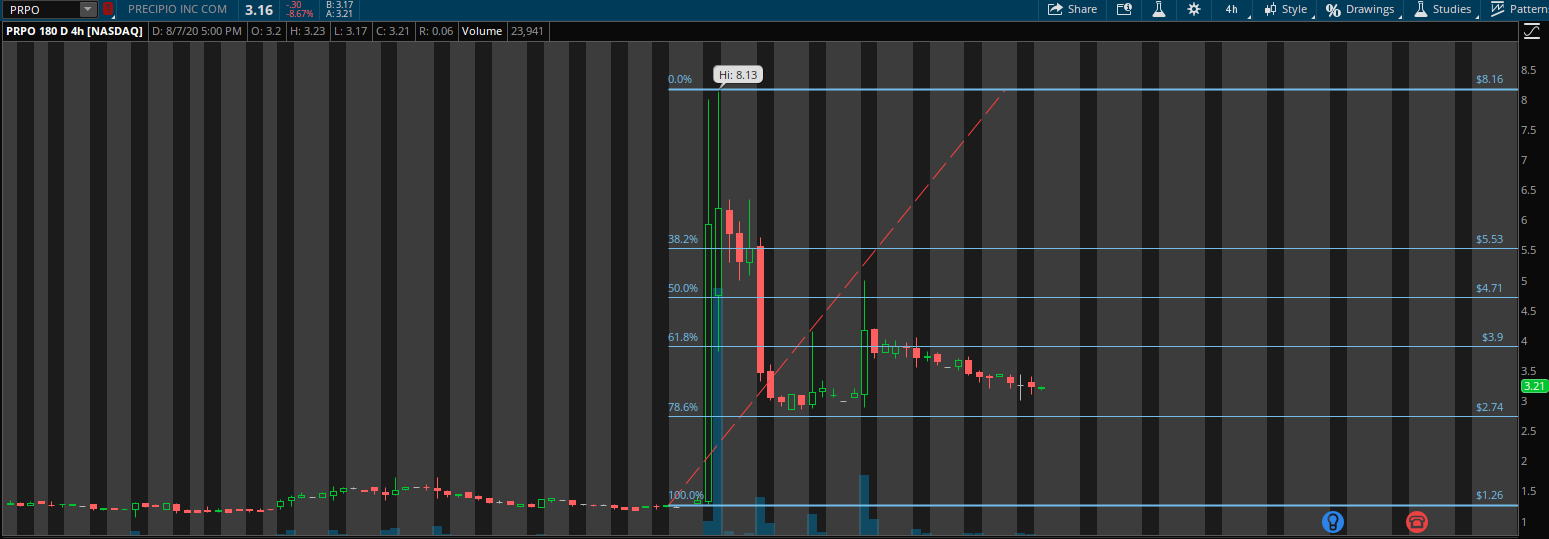
Notice those horizontal lines there?
That’s known as the Fibonacci retracement levels. These key levels are powerful when it comes to stocks that have made a large move and pulled back.
It’s what I like to call the “rest and retest” pattern.
I like to think about momentum stocks as a runner… you can’t go all out and just continue running higher without taking a breather… before continuing on the journey.
With this specific pattern, I want to focus on the horizontal lines.
The key Fibonacci retracement levels to focus on are typically the 38.2%, 50%, and 61.8%. However, in this market environment, I’ve noticed the 78.6% retracement level also comes into play.
For example, PRPO bounced right off the 78.6% retracement level and got back up to the 50% retracement level.
Right now, PRPO is pulling back into the 78.6% retracement level on the 4-hour chart, and the buyers may step in to bid this stock up again.
That’s why I want to keep an eye on the stock this week, as well as look for other momentum stocks exhibiting my favorite setups.
If you want to learn my techniques to uncover momentum stocks… BEFORE they run, then you’ll want to grab a complimentary copy of my latest eBook.
It details my number 1 edge in the stock market, and how I’m able to just look at chart patterns to effortlessly generate trade ideas.
0 Comments