In just a few hours, futures start trading and it’ll be interesting to see how the market interprets the $3T coronavirus relief bill.
Will stocks continue this remarkable bounce… or will they take a turn for the worst?
Who knows…
But I’ll be focused on my chart patterns because I believe by doing so, I can hunt down momentum trading opportunities.
Now, I recently opened up a discussion with readers — I received an overwhelming response and one question that kept popping up was, how do you set up your charts?
Well, for me, I like to keep things simple and just focus on indicators that work for me… then pair them with my bread-and-butter setups.
How I Set Up My Charts
When it comes to hunting down momentum stocks, I like to filter down potential opportunities with my scanner first.
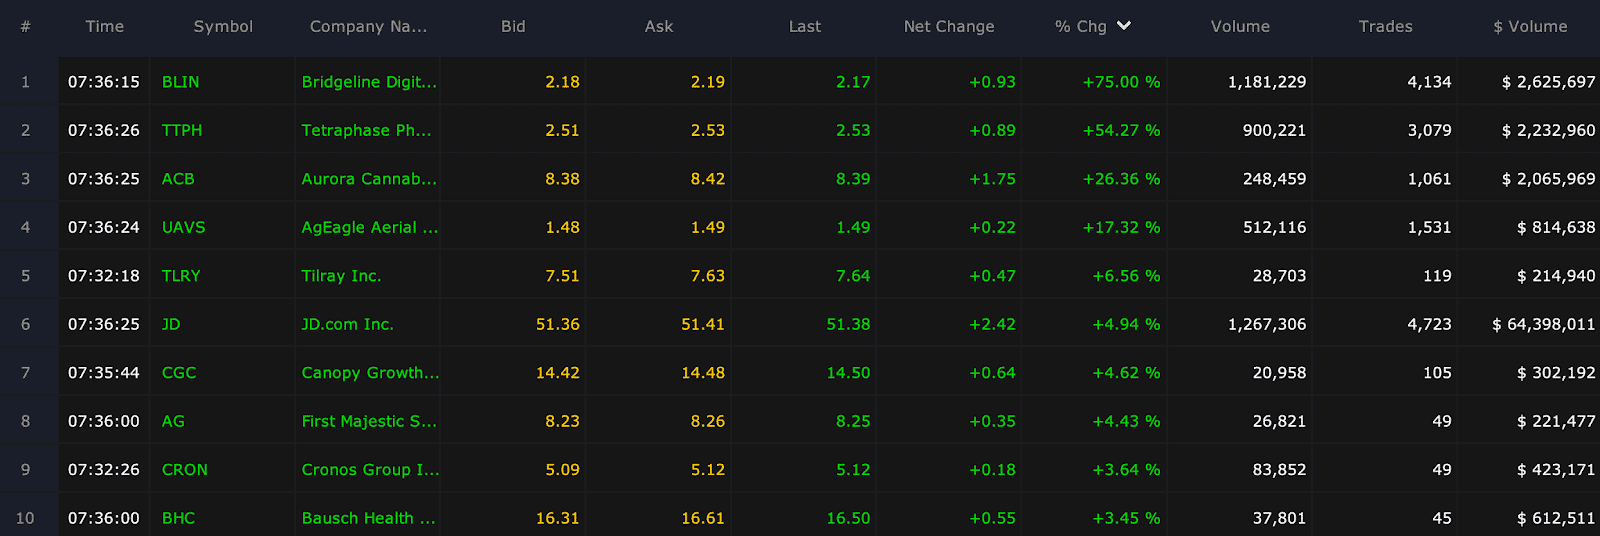
Source: Scanz Technologies
Basically, I want to look for liquid stocks to trade by filtering for stocks with a specified dollar volume. Thereafter, I sort by percentage gainers.
Now, once I’ve found a handful of stocks to potentially trade — I look at the charts. You’ve probably noticed them on my previous lessons…
However, I realized not everyone understands how I use them, so I want to give you a quick overview of some of the indicators I use.
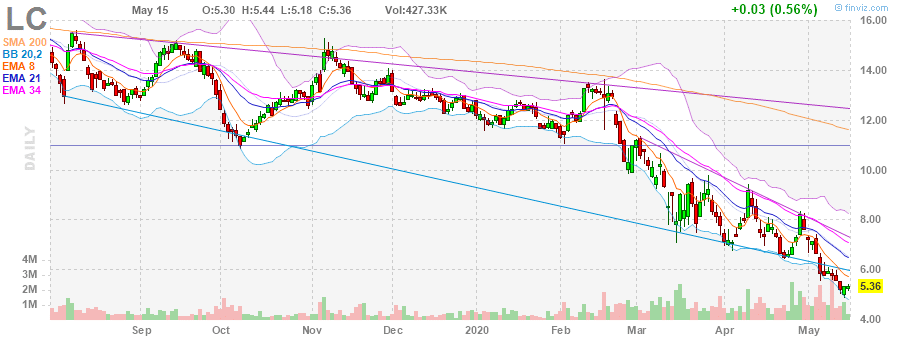
Source: Finviz
If you look at the chart above, you’ll notice a couple of lines that closely follow the price action. Now, if you look at the left-hand corner under the ticker “LC” — you’ll notice “SMA 200”, “BB 20,2”, “EMA 8”, “EMA 21”, and “EMA 34”.
I like to use these indicators in combination with each other, as well as my chart patterns.
I know what you’re wondering… “Jason, what do these all mean?”
Well, the first indicator you’ll notice is the 200-day simple moving average (SMA). I believe this is an important indicator because many traders and investors actually use it, and it helps me identify key levels to watch out for.
The next indicator I have on my charts is the “BB 20,2”.
The Importance Of Bollinger Bands For Momentum Traders
The second indicator on the chart is known as the Bollinger Bands. Now, there are actually 3 light-blue lines formed from this.
So what are the Bollinger Bands?
Well, they were developed by John Bollinger as a price envelope to help identify the upper and lower price range levels of a stock.
They way it works is there is one line in the middle, which is just a simple moving average. For me personally, I use the 20-period SMA. Then there are the upper and lower bands, which are calculated based on the standard deviation of price movements.
Don’t worry, typically, your charting software will do all that for you. The key is to understand how to use them.
Now, there are a few factors to keep in mind for traders who plan to use the Bollinger Bands:
- When Bollinger Bands tighten or consolidate, it’s a signal that there can be a large price move.
- When the price moves outside of the upper or lower bands, there could be a quick reversal in the cards.
- The stock can stay around the lower or upper band for an extended period of time, which is why I like to pair it with other indicators.
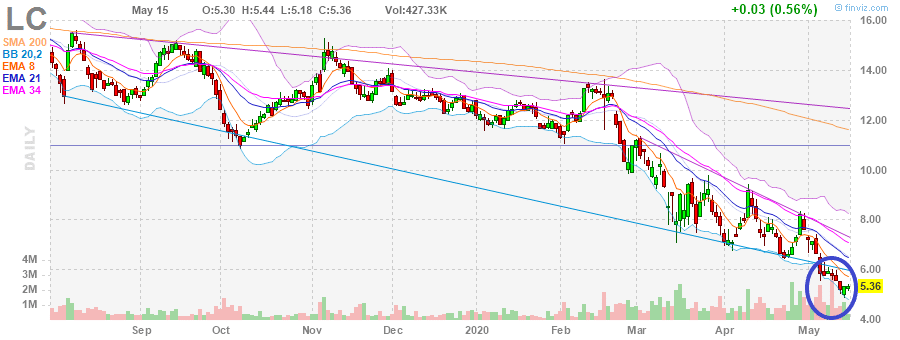
Source: Finviz
For example, take a look at the chart in LC again. The stock has been right around the lower Bollinger Band, and actually broke below. I actually noticed the fish hook pattern there… and here’s what I sent out to my subscribers about a potential trade in it on Friday.
LC is a stock I want to buy before the close. It’s reversing off Thursday’s $4.89 low and I think this is a good time for me to take a shot on the stock. Overall I get that it’s bearish but within that trend it’s been moving up and down in a channel and I think it could go for $6, maybe middle $6’s if that keeps up. I think 4,000 shares in the $5.30 – $5.40 range. I intend to buy this before the close today. 10% is my goal here. I’d be okay adding size if it weakened and then determine my stop loss from there. Looks like $5-$5.20 for that.
Now, the next indicators I use are exponential moving averages. I actually made a video lesson of how I used it with an options trade in AAPL…
Now, if you want to learn more about how I use my chart patterns to uncover momentum trading opportunities, you might want to check out my eBook — Momentum Hunter.
In it, I detail my #1 edge and the techniques I use on a daily basis to find some of the hottest stocks in the market, ahead of time.
Jason you have taught me so many great techniques. Just want to thank you.
Thnx. Jason. I truly appreciate ur illustrative-training. I remain teachable/coachable.