Well, it’s the last trading day of the year… and when Thursday’s session rolls around it will be a brand-new decade of trading — that means it’s time to turn it up and attack 1Q 2020.
How am I attacking the first three months of the year?
By turning to small-cap momentum stocks. As I reviewed my trading performance in early 2019, I thought about the strategies that helped me profit—along with all the junk that cost me money.
The first step is to cut out everything that isn’t working.
If you’re trying to develop a strategy, you can paper trade before you start throwing around your hard-earned money into the market.
The second step is to focus on your strengths.
For me, I’m going to focus on my fish hooks and rockets. These patterns are not only repeatable, but they’re also scalable. That means there really isn’t a limit to how much you can make from them come 2020.
If the trading terms fish hooks and rockets appear foreign to you—no need to fret.
I’m going to thoroughly go over them with you.
I suggest you grab a pen and a notepad.
Why?
Because these two patterns alone are responsible for more than half of my trading profits this year.
And the best part, they are easy to learn.
Two Patterns to Help You Succeed in 2020
Fish hooks and rockets are my favorite patterns because they work well in ANY market environment.
You see, when the overall small-cap market is strong… you’ll see rocket patterns all over the place. On the other hand, when they’re selling off… we tend to see more fish hooks.
When it’s choppy price action li… it’s been a mix between the two.
That way, whether we’re in bullish, bearish, or sideways markets, I double my chances of success. Since the markets are still right around all-time highs, I want to show you how the rocket pattern works.
Basically, it’s a breakout pattern where there’s an uptrend and the stock approaches a resistance level.
A lot of the times, as the stock approaches that key level… it attracts buyers and the price rockets higher.
Let me show you what I mean by that with a trade example. Of course, I can show you massive winners… but I want to be real with you and show you what I do on the reg.
Here’s a look at what I sent out to my clients about a recent rocket pattern.
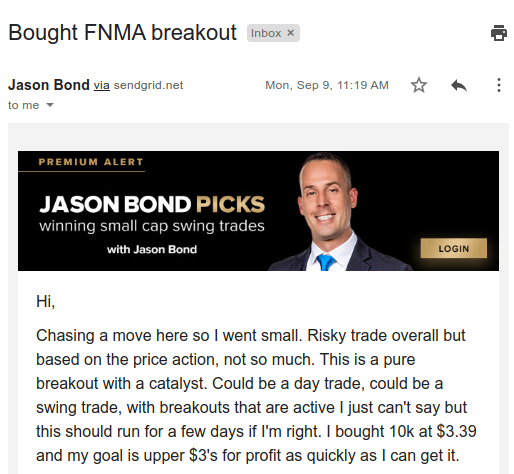
Fannie Mae (FNMA) is one stock that I’ve traded countless times… and I know my patterns are repeatable when it comes to small-cap momentum stocks.
If you look at the chart below, you will see a blue horizontal line.
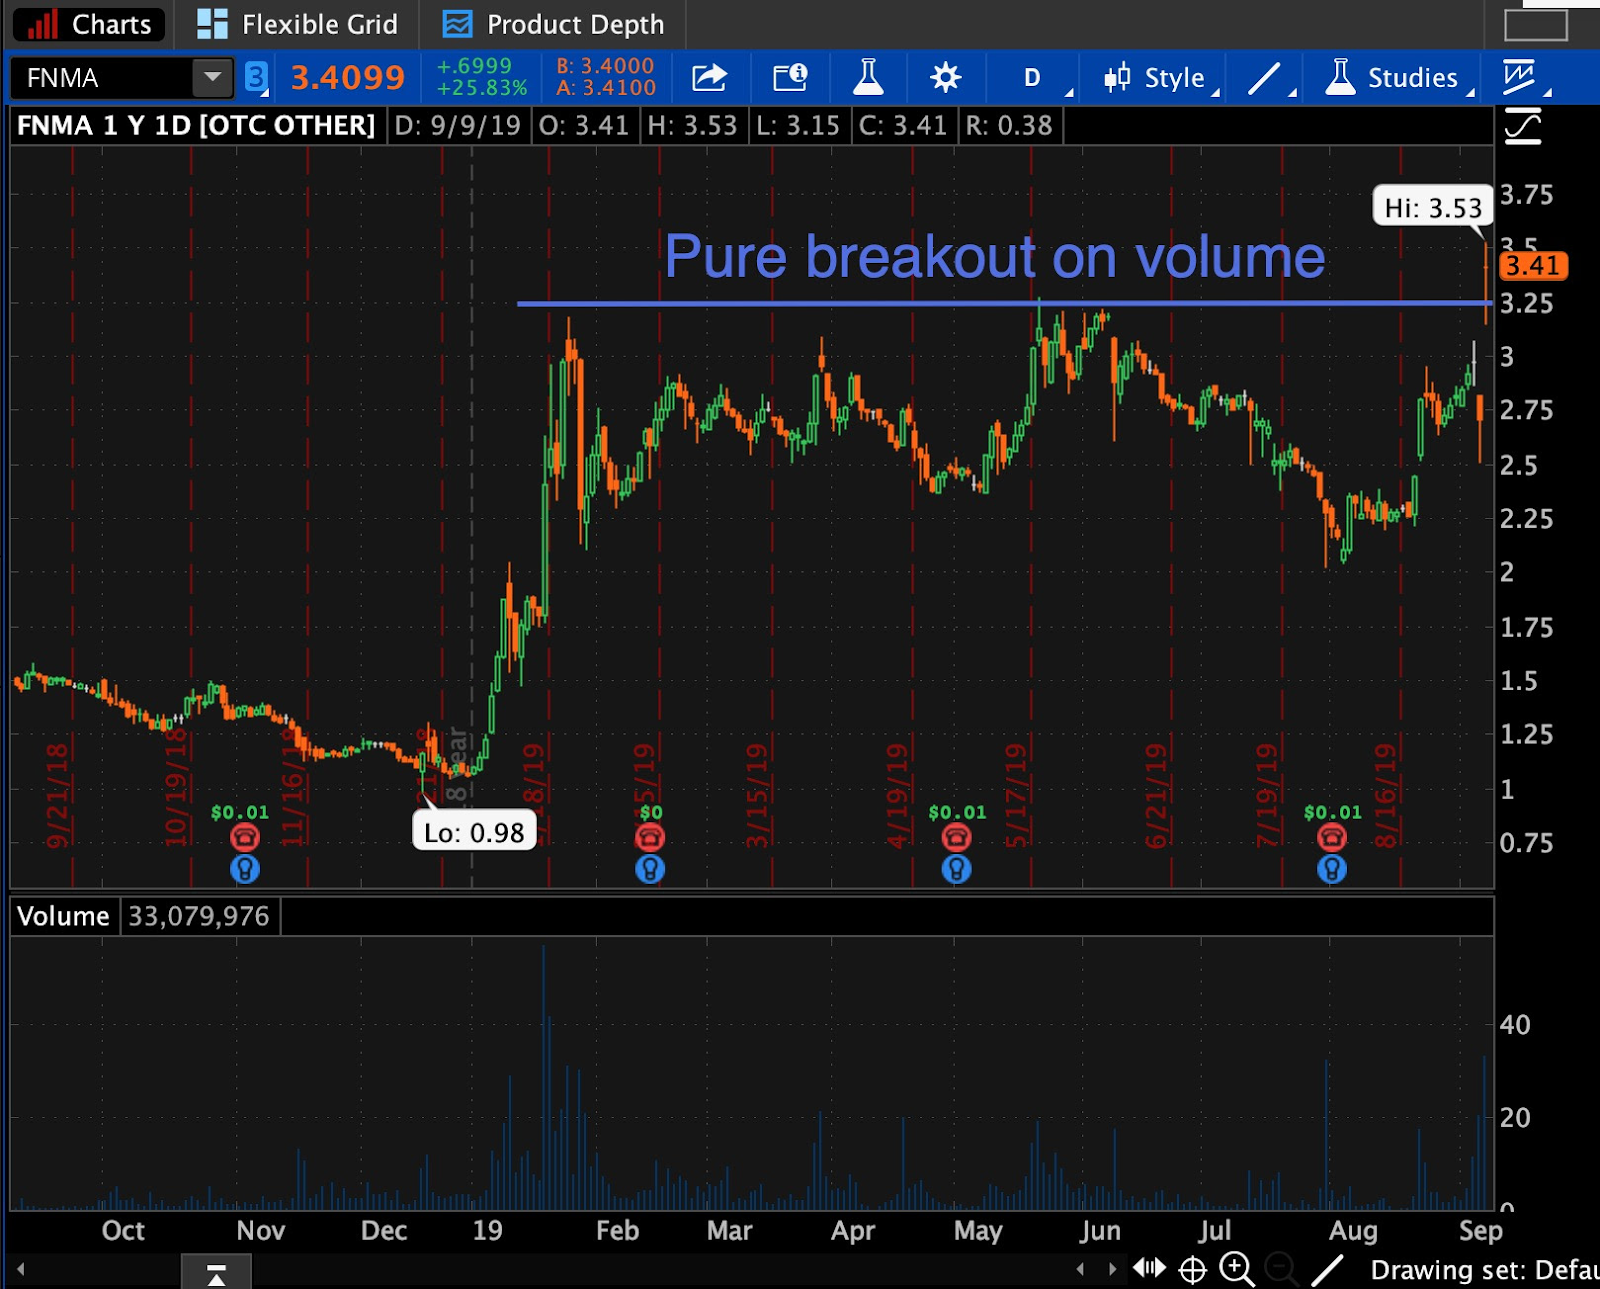
That’s the resistance line. This is an area where the stock has had a hard time breaking above… and the sellers were running wild, pushing FNMA back down every time it got near that level.
However, this time (when I actually bought the stock) was the third time it was trying to break above that level…
… and you know what they say… the third time’s a charm…
… and FNMA actually rocketed above that level!
At some point, the sellers get tired… and they run out of supply. What happens after is when there’s heavy demand for the stock, and no supply… the stock breaks above that ceiling…
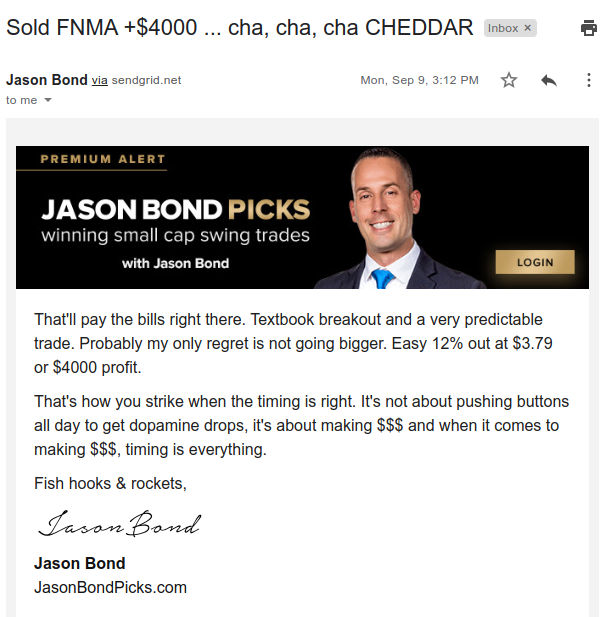
That very same day, I locked in a $4,000 winner (or 12% in just a few hours).
The whole idea is to spot a resistance level and the stock trending upwards on volume. There are two ways to play it… you could either buy in anticipation of the break above… or wait for the break out before buying shares.
On the flip side, there’s the fish hook pattern.
Fish Hooks Reel in Massive Winners
The fish hook is one pattern that I like to use to spot oversold stocks. Basically, if the overall small-cap market is weak… we’ll see more fish hooks, as stocks are under the water.
However, you can still spot these patterns in choppy or bullish conditions.
Here’s how the fish hook pattern works.
Basically, we look for 3 things:
- A big drop in the stock
- Stock finds a key support level and holds
- Look for stock to rebound.
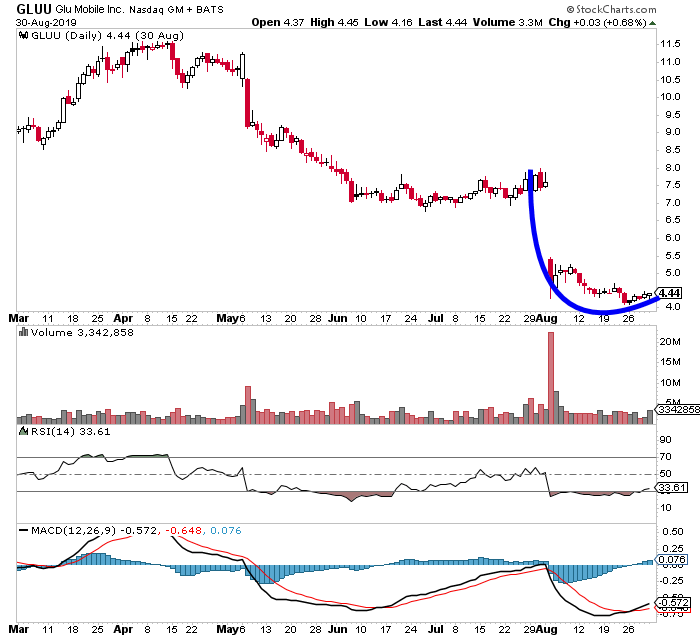
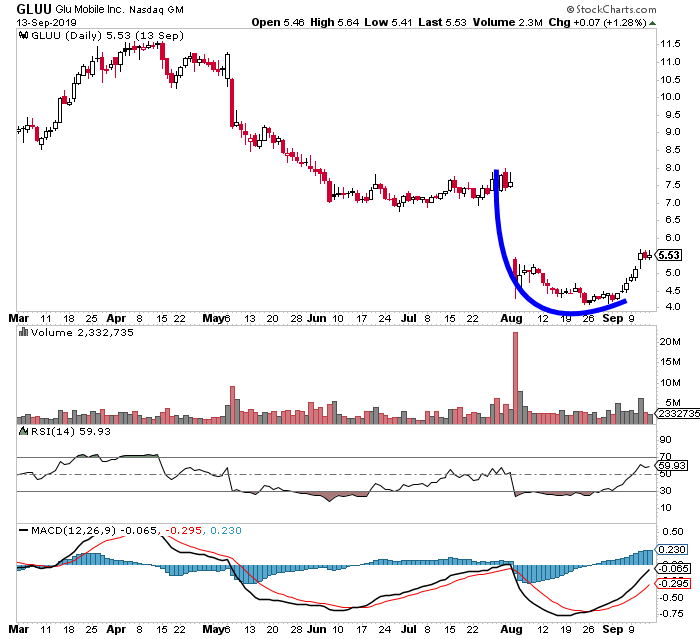
If you look at the chart in Glu Mobile Inc. (GLUU) above… the fish hook pattern was there… and it has support at $4… and started to bounce.
Once I got to my profit target… I took GLUU off for a base hit to lock in a safe winner.
However, for those who stuck around in the trade… they would’ve locked in a massive winner… because here’s what happened with it after.
The reason why I use the fish hook and the rocket is due to the fact I can attack the market in any way I choose… if the market breaks out, I know to use the rocket pattern… if it sells off, I’ll look for fish hooks.
If it’s choppy price action, all the better because I could use both of those patterns…
I want to leave you with some quick tips and lessons to get you ready for the first quarter of 2020, especially if you’re trading small-cap momentum stocks.
- Well defined position size — make sure to limit bet sizes and have a max allocation rule. What I mean by that is I won’t use more than $XXXXX per position. Scale into trades, and don’t just get into your maximum position size all at once.
- Have an edge and plan — some traders like to go with their gut, rather than have a clear edge. Sure it works some times, but I don’t think it’s something you can bank on making your career from.
For me to consider entering a trade, my patterns need to be there, otherwise, I’m looking for a new play.In other to maintain composure and hunting for my patterns… I have detailed plans and watchlists, which I send to all my clients. - Focus on proven chart patterns — I’ve been trading small-cap momentum stocks for years, and I know which patterns work… and which ones don’t.
0 Comments